The derived methodology on assessing land desertification risk
The proposed number of indicators, even though they were all directly or indirectly related to land degradation and desertification, was too large to be practically applicable. The list of indicators was substantially decreased after the statistical analysis to the most appropriate and effective indicators suited to the range of local physical and socio-economic conditions of the study field sites. As Table 1 shows, the number of indicators related to water erosion in cropland, pastures, and forest was reduced from 49 to 17, 15, and 11, respectively. The number of candidate indicators assigned were 16, which were reduced to 10. The impact of soil salinization on land degradation and desertification can be assessed by using 9 indicators. The greatest number of candidate indicators described was for water stress, reduced from 50 to 12 indicators (Table 1). Finally, the candidate indicators identified for the causes overgrazing and forest fires were substantially reduced from 44 and 29 to 16 and 8, respectively.
Table 1. Number of candidate indicators used for the analysis and number of effective indicators for each process or cause of land degradation and desertification
| a/a | Degradation process | Major land use | Number of candidate indicators | Number of effective indicators |
| 1 | Soil erosion by water runoff | Agriculture | 49 | 17 |
| Pastures and shrubland | 49 | 15 | ||
| Forests | 49 | 11 | ||
| 2 | Tillage erosion | Agriculture | 16 | 10 |
| 3 | Soil salinization | Agriculture, natural vegetation | 27 | 9 |
| 4 | Water stress | Agriculture, natural vegetation | 50 | 12 |
| 5 | Overgrazing | Natural vegetation, agriculture | 44 | 16 |
| 6 | Forest fires | Natural vegetation | 29 | 8 |
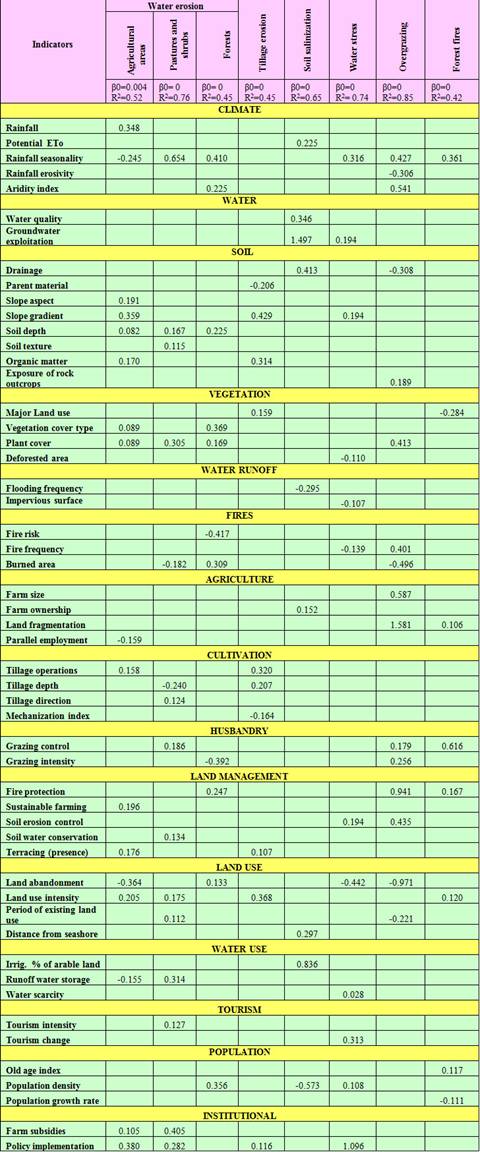
Table 2 gives the coefficients of linear regression for each indicator and process identified in the study sites for the linear model assessing land degradation and desertification risk. The correlation coefficients (adjusted R2) range from 0.42 to 0.85 (Table 2). The lowest correlation was found for the indicators assessing desertification risk index in areas affected by forest fires. The highest correlations was found for indicators relating desertification risk in areas affected by overgrazing.
The algorithm for assessing desertification risk index (DRI) for each process or cause can be defined by combing the indicators presented in Table 2 with the corresponding linear coefficient values in the multiple regression equation. As an example, the following algorithm corresponds in the assessment of desertification risk index for areas in which the main cause of land degradation is water stress:
DRI = 0.316xRS + 0.194xGE + 0.194xSG - 0.110xDA - 0.107xIS - 0.139xFR = 0.194xSEC - 0.442xRLA + 0.028xWS + 0.313xTC + 0.108xPD + 1.096xPI.
Where: RS is rain seasonality, GE is ground water exploitation, SG is slope gradient (%), DA is rate of deforested area (% per year), IS is impervious surface area (ha per 10 km2 of territorial surface per 10 years ), FR is fire frequency (years), SEC is soil erosion control (area protected per total area, %), RLA is rate of land abandonment (ha per 10 years per 10 km2) , WS is water scarcity (Water available supply per capita / water consumption per capita during the last 10 years), TC is tourism change (number of overnight stays in a specific destination over one year / average overnight stays in the last 10 years, %), PD is population density (people per km2), PI is policy implementation of existing regulations for environmental protection. The DRI is estimated by multiplying coefficient of linear regression for each indicator by the weighing indices of the corresponding class of indicator given in Table 2 (deliverable 2.1.3).
Table 2. Coefficients of linear regression analysis for assessing land degradation and desertification risk in various land uses and degradation processes or causes
