|
Monitoring activities and flow connectivity issues
Author: Lorenzo Borselli (CNR-IRPI)
Note: because it was not possible to engage the cooperation of local farmers to provide sites for field experiments, work in the Rendina study site concentrated on the development of indicators relating to sediment delivery and shallow landslides (Research Theme 2) and development of the PESERA-L model (Research Theme 5).
Study Site description
|
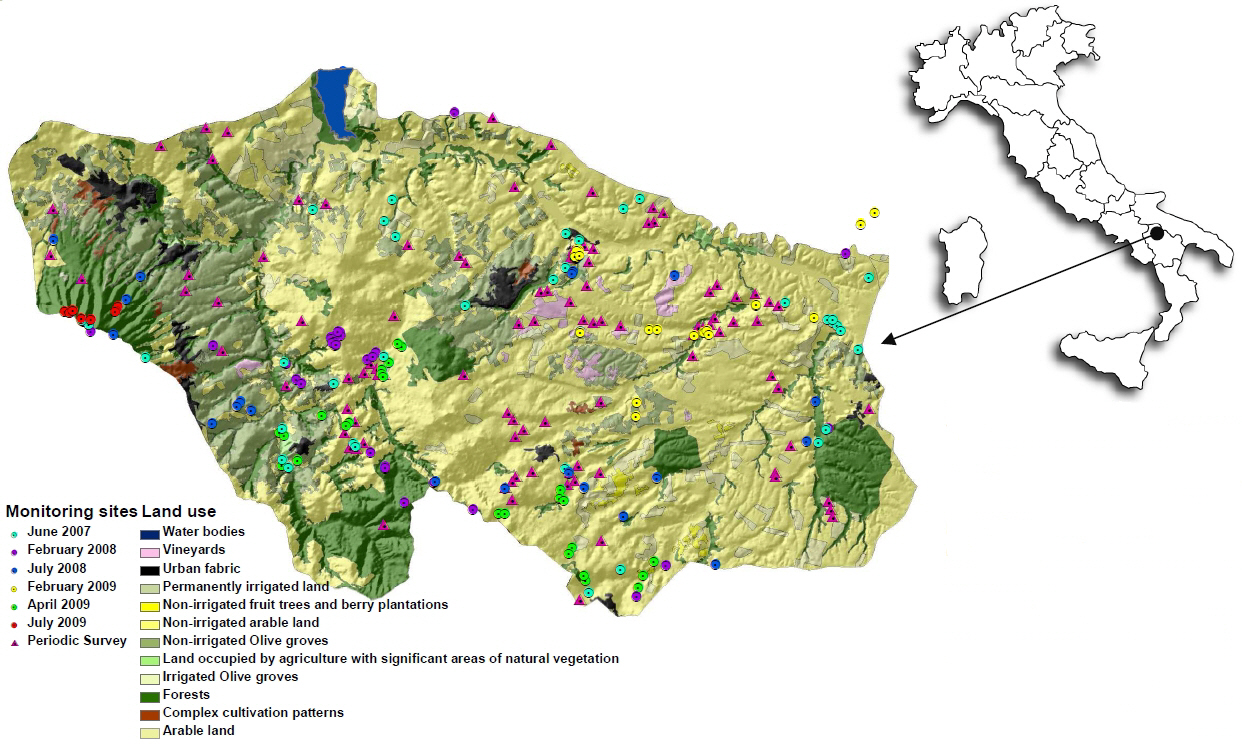
The study site is located in Basilicata (Italy) and represented by the upstream areas of the Rendina reservoir. The Rendina catchment is a strategic catchment because of the essential role it will play in mitigating the effect of global warming and desertification in the surrounding areas, under the condition that it is well managed and its functions conserved and improved. Hence the present situation in the Rendina basin is not one of desertification but of degradation, mainly due to excessive sediment production and agricultural mismanagement.
|
Situation: large watershed of 410 km² (coordinates: 4543166 N, 550356 E and 4523186 N, 583602 E).
Physiography: complex mountain slopes, slightly to moderately steep, undulating hillslopes, alluvial floodplains of the Venosa torrent and fluvio-lacustrine terraces with strong incision by the Venosa torrent.
Geology: alluvial and colluvial sediments, with clayey and sandy granulometry, pyroclastic colluvial deposits, Pleistocene conglomerates, clayey slate and marls.
Pedology: see the soil map in nearby picture.
Annual rainfall and seasonality: Annual rainfall is 500 mm with two rainy seasons, from October to November and March to May. Evaporation is up to 1100 mm annually. BG aridity index is 65.
Main land uses: arable lands herbaceous crops, olivegroves, vineyards and urban areas.
|
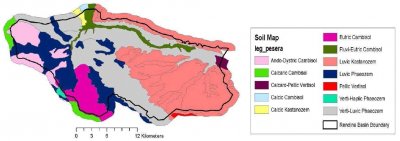 |
Soil map of Rendina Basin (Classification WRB’98). Source: E. A. C. Costantini, F. Urbano, G. L’Abate. SOIL REGIONS OF ITALY www.soilmaps.it |
Monitoring activities
The objective of the monitoring plan is, considering the catchment as a whole and some subcatchments, to produce a set of maps with the identified erosion soil processes (e.g. classification, severity, changes and rates). The main monitoring activities are:
|
1) Soil erosion by water
(twice a year)
- Gully erosion
- Rill erosion (density and geometrical characteristics)
- Sheet and splash erosion indicators (as pavement formation by and crusting and sealing, depositional pavement and splash pedestals etc.)
(Periodic surveys)
- A person living in the area, will alert us in case of intense events and is trained to make observations related soil erosion processes ( ephemeral gullies, rill and sheet erosion and sedimentation, position in UTM coordinates , land use, depth, width, slope gradient etc.).
|
2) Mass movements
(once a year)
Measurement:
- depth of soil layer involved,
- slope gradient,
- extension of landslides areas,
- distance form permanent drainage line and level of connectivity with it.
Control:
- position (UTM coordinates)
- particular geomorphological characteristics
- processes (flow slide, translational landslides, mud flow..),
- type of soil
- lithology of substratum,
- main land use
- management techniques,
|
|
3) Soil erosion by tillage
(once a year)
Measurement:
- upper field border,
- longitudinal field border,
- areas close to electricity and telephone poles inside the field
- deposition lower field border
|
4) Soil erosion by land levelling
(once a year)
- control areas with accumulation of stones at the field borders or in the middle of fields
- control scared areas with a lower canopy cover during the begin of growing season
- measurement of amount of soil removed or accumulated downslope.
|

Connectivity index model
 |
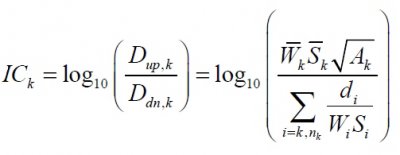 |
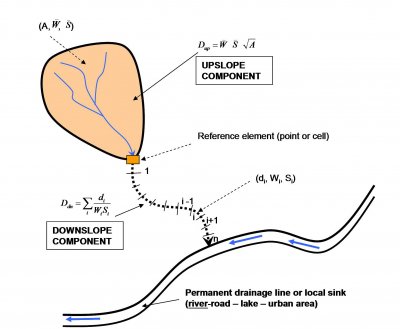
The Connectivity Index (IC)
value is computed using two
components:
- Downslope component: is the sinking potential due to the path length, land use and slope along the downslope route.
- Upslope component: is the potential for down routing due to upslope catchment's areas, mean upslope and land use.
|
| Borselli et al. (2008). Prolegomena to Sediment and flows connectivity in the landscape: a GIS and field numerical assessment. CATENA (Elsevier) |
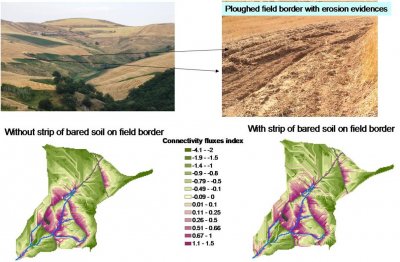 |
The fluxes Connectivity Index evidences the effects of the land management practice on sediment production. Prevailing land use of the watershed is wheat crop. The connectivity index is evaluated before and after harvesting (June) when the borders of the fields are ploughed for 5 meters wide. |
| The monitoring activities let us to identify positive effects on soil erosion and degradation |
- Connectivity monitoring and analysis will allow assessing connectivity variation and reduction in connection with SWC at watershed level.
- Shallow mass movements will be evaluated for their on site contribution to degradation – for evaluating their off-site contribution, by and their own degree of connectivity with the drainage network.
|
|

