|
Calibration of the PESERA model
In »PESERA-DESMICE: Land management evaluation model it is described how the biophysical model proposed for the DESIRE project builds on and extends the PESERA model (Kirkby et al., 2008), originally developed for Pan-European Soil Erosion Risk Assessment within a dedicated EU (FP5) project. The original PESERA model was extended to capture the role of grazing, fire and wind erosion more effectively, and enhance pedotransfer functions on the basis of dialogue and data within each study area; this work is described in »PESERA: improved biophysical descriptions. In this section we describe how, in order to generate model output for each DESIRE study site, PESERA was adapted to reflect indicators and land degradation drivers identified in Phase A of DESIRE (»Study site contexts & goals: local desertification extent and impact and »Assessment with land degradation indicators) as closely as possible. The modified model was used to look at the biophysical effects of different remediation options that have been trialled in study areas.
The strategy to do this is by comparison of baseline to modified conditions:
- The PESERA baseline is an assessment of a series of biophysical descriptors at an equilibrium state driven by mean climate, land use, soil and topography. These descriptors are an estimate of monthly estimates of biomass (productivity), runoff and erosion. The PESERA baseline assessment was achieved with best understanding and interpretation of current land management practice and technologies, and constitutes the "without" case in technology assessment.
- The adapted PESERA assessment is a representation of the same biophysical descriptors, but now evaluated as the simulated effects of a specific desertification remediation option. Adapted assessments were achieved with best understanding of the functioning of technologies. It hence forms the "with" case of technology application.
Both baseline assessments and adapted PESERA assessments are input for DESMICE.
Climatic regimes and appropriate technologies
The DESIRE study sites represent a very wide range of climatic conditions, and the climate exerts perhaps the strongest constraint on what are appropriate remedial technologies. Figure 1 illustrates this climatic range. Months represented as points above and to the left of the Rf=PE have insufficient water for unrestrained growth, so that water is a limiting resource. If rainfall is less than about 60% of the potential evapotranspiration during the growing season, then rain-fed agriculture is severely limited, and only some specialised crops, such as olives or agave, can survive without irrigation. However, the high temperatures provide good conditions for rapid growth, and often for several crops per year where irrigation water can be provided economically.
The various climatic regimes provide different constraints to sustainable land use, and these are summarised in Figure 2, drawn with the same axes and scales as Figure 1. Under appropriate conditions, the greatest constraints may be through wind or water erosion, water scarcity, wildfires or frost damage.
 |
 |
| Figure 1: The climatic environment of study sites. Loops show mean monthly precipitations and temperatures for representative DESIRE study site areas. |
Figure 2: Factors that constrain sustainable land use. |
PESERA adaptation for DESIRE technologies
Many of the DESIRE technologies consider rainfed cereal agriculture, where natural soil erosion rates are increased by an order of magnitude with long term on- and off-site impacts. Other technologies focus on biomass protection but more commonly on a combination of more than one technology (Table 1).
Table 1: Mitigation measures accommodated within the adapted PESERA modules
| DESIRE study site |
Baseline (PESERA/ site) |
Tillage
(minTill /redTill /noTill) |
noTill/ subsoil |
Mulch/ stubble |
Cont. plough |
Grass terrace/ woven fences |
Water/soil harvesting |
Biomass protection/ recovery (green cover) |
| Sehoul |
yes |
yes |
|
|
|
|
|
atriplex/
resting |
| Karapinar |
yes |
yes |
|
yes |
|
|
|
|
| Eskişehir |
yes |
|
|
|
yes |
yes |
|
|
| Guadalentín |
yes |
yes |
|
yes |
|
|
|
|
| Secano Interior |
yes |
yes |
yes |
|
|
|
|
|
| Yan River Basin |
yes |
yes |
|
|
|
yes |
check-dams
|
|
| Cointzio |
yes |
yes |
|
yes |
|
|
|
(agave) |
| Riberia Seca |
yes |
|
|
|
|
yes |
|
pigeon peas |
| Zeuss Koutine |
yes |
|
|
|
|
|
jessour
|
resting |
| Góis |
yes |
|
|
|
|
|
|
prescriptive fires |
| Mação |
yes |
|
|
|
|
|
|
preventative fires |
| Boteti |
|
|
|
|
|
|
|
biogas |
In rainfed cereal agricultural protection from erosion is generally most effective through measures that increase infiltration rates and so reduce the amount of overland flow runoff and soil loss. The most reliable measure is generally to increase ground cover. In areas at greatest risk, this may require the maintenance of a natural vegetation cover (without excessive grazing), but a number of conservation measures can reduce erosion within cropland. Inter-cropping ensures ground cover throughout the rainy season. Strip cropping reduces the distance over which runoff can build up before flowing back into a vegetated strip. Terracing reduces the overall gradient, and so the erosive power of runoff, but must be combined with measures to protect the over-steepened terrace risers, by strengthening them with stone or perennial vegetation and/or by diverting runoff away from them. Over time, terraces generally accumulate deeper soils along their lower margins, often at the expense of the upper part of the terrace, and the deeper soils may help to retain more water for the growing crops. Table 2 shows typical change in PESERA parameters and variables used to simulate mitigation options and associated changes in cultivation management.
Table 2: Typical change in PESERA parameters and variables used to simulate mitigation options
| |
Vegetation
cover (kg/m²) |
Ground
cover
(%) |
Humus (kg/m²) |
Crust |
P1swap1 (mm) |
Rough (mm) |
Re- infiltration
(mm) |
| minTillage |
+ |
+ |
+ |
- |
|
|
|
| Ploughed stubble |
|
|
+ |
|
|
|
|
| stubble |
+ |
+ |
+ |
|
|
|
|
| Contour ploughing |
|
|
|
|
|
+ |
+ |
| Woven fences/ terraces |
|
|
|
|
+ |
|
+ |
Prescriptive and preventative management is adopted in areas prone to wildfire (Esteves et al., 2012). Wildfire occurs wherever there is a substantial accumulation of dry above-ground biomass. This combination is usually associated with forest or shrub vegetation rather than with cropland. Fires are generally ignited either by lightning strikes, which are generally more frequent in the tropics, or through human intervention, either deliberate or accidental, related to the number of people using or visiting the forests and so substantial in Europe with its high densities of roads and population. Fires, once started, are most severe when the biomass loading is high, but they spread most quickly when the biomass is less and wind speeds are high, so that the fire moves through the canopy and burns the soil less severely. Under severely water-scarce conditions, biomass is dry, but too sparse to support large fires. Under humid conditions, there is a high biomass but it rarely dries out enough to support a fire. Intermediate conditions provide the conditions of greatest fire risk, with sufficient moisture to provide good growth and a dry season to reduce the moisture content of the canopy. Figure 3 shows how the greatest risk is associated with these intermediate areas.
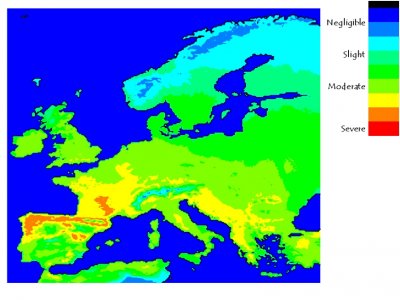 |
Figure 3: Climatic component of wildfire risk for Europe under natural vegetation. |
Scenario analysis with DESMICE model
The DESMICE model is developed as a series of ARCGIS Modelbuilder modules with subroutines programmed in Python. As explained in »PESERA-DESMICE: Land management evaluation model the socio-economic model (DESMICE) informs PESERA where remediation technologies can be implemented, and PESERA provides the biophysical output on which DESMICE will subsequently elaborate to calculate economic feasibility. Relative to the original model description, some simplifications were implemented. In some cases, this reflects the fact that data was limited. However, this also stems from a separation of model steps and scenario analysis, reducing the number of model steps from 12 to 6. The 6 model steps are shown below:
| 1. First it is necessary to define where each technology can, on biophysical grounds, in principle be applied. This is an important step in that it rules out the area where technologies cannot be applied e.g. terraces on steep slopes with shallow soils. Factors considered include: soil depth, slope, land use, climate and distance to streams. |
 |
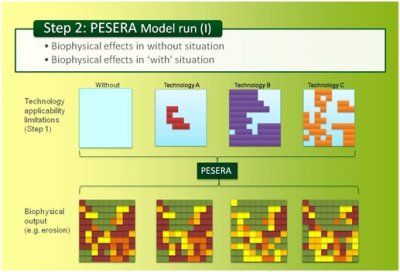
| 2. The PESERA model is run, taking into account each technology’s potential applicability area, and compared to a case where no technology is applied. In practice, applicability limitations can also be clipped out later to reduce coordination effort. |
 |
| 3. WOCAT technology questionnaires currently show only one cost estimate; in reality this will depend on location. DESMICE can consider two different aspects: environmental conditions (e.g. terrace spacing and hence cost depends on slope) and distance to market. The latter functionality was not implemented in the analyses for this report. |
 |
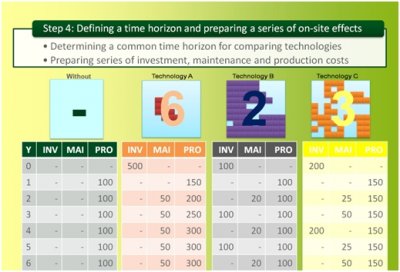
| 4. The technologies that are being assessed may have different economic lifetimes. Therefore, shorter-lived technologies are assessed over several cycles of re-investment (over the length of time that the longest lived technology is likely to last for). Years of (re-)investment are filled first; maintenance costs are subsequently added for years in between investment. Production costs need also to be considered because application of technologies may lead to a change of land use or use of input (e.g. more labour because of larger harvest). |
 |
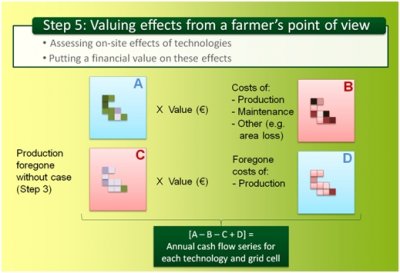
5. To value effects of a remediation strategy, the following will be assessed on a yearly basis for the lifetime of the technology (or multiple lifetimes):
A. Evolution of production output (yield x value) over time
B. Evolution of costs of implementing the technology and land use associated with it
C. Evolution of production output (yield x value) as it would develop were the mitigation strategy not applied
D. Evolution of the costs associated with the land use in this ‘without’ case
For each year, the net result can then be calculated as [A-B-C+D] (note that benefits and costs may vary both in space and time). |
 |
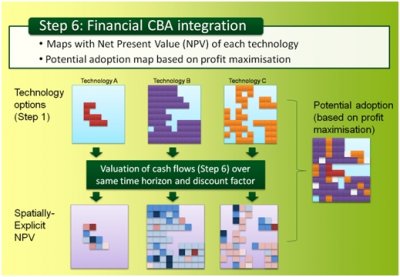
6. The annual cash-flows of step 5 are subsequently used in a Financial Cost-Benefit Analysis (FCBA). An important issue in FCBA is discounting, i.e. introducing an interest rate that depreciates costs or benefits occurring in the future relative to those felt now. Summing discounted cash-flows gives the Net Present Value (NPV) for each technology. For each grid cell, one of the following three possible outcomes will apply:
• The technology with highest NPV will be selected (when positive) (the adoption grid shows a possible configuration of technology A, B and C)
• No technology will be selected if all NPVs are negative (i.e. white pixels in potential adoption grid)
• No technology will be selected if no technology is applicable in the area (blue cells in adoption grid) |
 |
Model input data primarily comes from the WOCAT database. Additional data requests were made using two information sheets (for study sites and technologies respectively). Furthermore, data from field trials were used in parameterizing the DESMICE model.
Different types of scenarios were developed to simulate the effects of proposed remediation strategies as well as of policies. These were:
- Baseline scenario, the PESERA baseline run, see above.
- Technology scenario, assessing the effects and financial viability of mitigation options for those areas where they are applicable.
- Policy scenario, assessing the effectiveness of financial incentive (and alternative) mechanisms to stimulate adoption of technologies if they are not economically attractive. Local policies have in some cases been considered based on information from WB1 and study sites.
- Adoption scenario, considering the simulated technologies (if more than one) in conjunction and assumes that the most profitable option has the highest potential for uptake by land users. In order to make the net present value of different options comparable, the same time horizon is applied to the analysis.
- Global scenario; two types were defined, the food production and minimizing land degradation scenarios. The food production scenario selects the technology with the highest agricultural productivity (biomass) for each cell where a higher productivity than in the baseline scenario is achieved. The minimizing land degradation scenario selects the technology with the highest mitigating effect on land degradation or none if the baseline situation demonstrates the lowest rate of land degradation.
The combined PESERA-DESMICE model was run for all study sites with data and degradation processes for which the model can be applied to simulate both the bio-physical and socio-economic consequences of these scenarios. The field data collected in Phase C of DESIRE »Implementing & monitoring field trials part of allowed performing a calibration check to get biophysical effects in the right order of magnitude. Model output was discussed in final stakeholder workshops to allow further broad-based qualitative evaluation of integrated model results. The evaluation is discussed in »Evaluation of remediation recommendations.
|

