Home 5. Regional strategies Model applications Synthesis of scenario results for all study sites

Synthesis of scenario results for all study sites Print

PESERA-DESMICE simulations were made for 12 study sites of the DESIRE study sites (see individual study sites sections for details). The DESMICE model was also applied in a non-spatially explicit manner to assess biogas as a desertification mitigation option in the Boteti area in Botswana (Perkins et al., in press) and is included in this cross-site analysis as well.


1 Botswana (Boteti)

2 Cape Verde (Ribeira Seca)

3 Chile (Seccano Interior)

4 China (Yan River Basin)

5 Greece (West-Crete)

6 Mexico (Cointzio)

7 Morocco (Sehoul)

8 Portugal (Góis)

9 Portugal (Mação)

10 Spain (Guadalentín)

11 Tunisia (Zeuss-Koutine)

12 Turkey (Eskişehir)

13 Turkey (Karapinar)

Figure 1: Locations of DESIRE study sites for which PESERA-DESMICE was run.


The remaining study sites have not been included in this report for a variety of reasons. In the Rendina basin (Italy) shallow landslides are the main land degradation problem for which PESERA was extended (PESERA-L ; Borselli et al, 2011). The temporal and spatial dimensions at which shallow landslides occur are not readily translatable in land use management options for which to conduct a cost-benefit analysis, and therefore the DESMICE model could not be applied. However, the results of PESERA-L are described in DESIRE report 82 (Borselli et al, 2011). The Nestos River Delta site (Greece) and two Russian study sites (Novy and Dzhanibek) feature salinization and water logging problems for which PESERA is not applicable. In principle, it would be possible to couple the DESMICE model with alternative models that are more suitable for these problems than PESERA. The biophysical model results for the Russian sites are presented in the individual study site sections. 


PESERA Baseline runs
Baseline assessments of soil erosion under current conditions were made for a range of study sites (Figure 2). Comparing these assessments, it becomes apparent that there are large differences between sites. One very remarkable result is the low degradation problem in Karapinar (Turkey). In this site, wind erosion rather than water erosion is the main degradation problem. Either lower soil loss rates are already alarming or wind erosion processes were not adequately modelled, e.g. because of a lack of good wind speed data. PESERA results put the Seccano Interior (Chile) in first place regarding the severity of soil erosion, while Yan River Basin (China) and Eskişehir (Turkey) also rank high. West-Crete (Greece), Cointzio (Mexico) and Sehoul (Morocco) show a more mixed picture, with both pockets of unaffected and severely affected land. According to these results, the Guadalentín (Spain) and Zeuss-Koutine (Tunisia) areas are only moderately affected by soil erosion.


Figure 2: Overview of PESERA baseline run erosion rates for selected study sites

Figure 3: Degradation degree and extent in study sites according to WOCAT mapping.
Source: Van Lynden et al., 2011

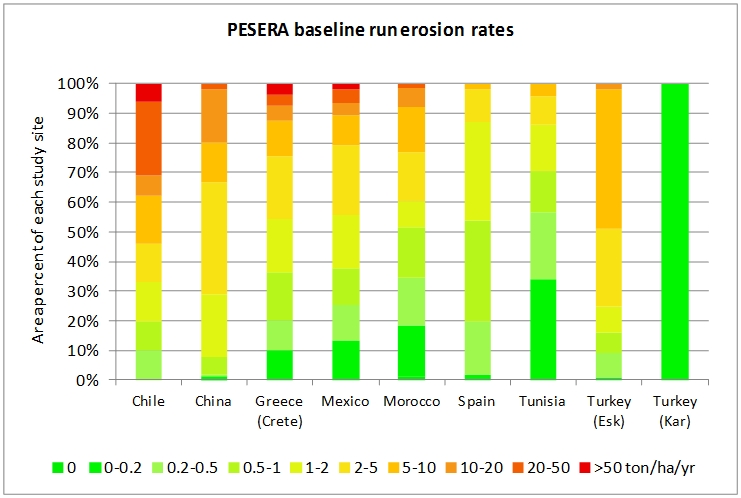
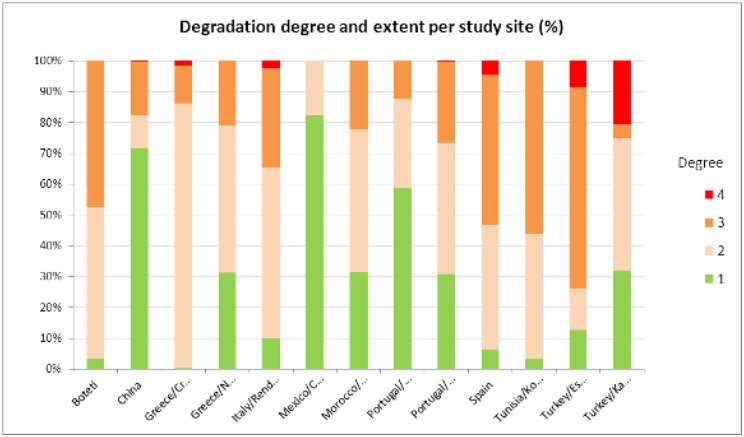
It is interesting to compare model assessment of soil erosion with land degradation mapping using expert knowledge (Figures 2 and 3). The latter was done in WB1 using the WOCAT mapping method (Van Lynden et al., 2011). When comparing Figure 2 with Figure 3 (taking care that not all sites feature in both charts), one can note:

  • China – that the proportion of the area affected by serious land degradation is roughly similar; experts are more optimistic in classifying the remaining land as little affected than model results suggest;
  • Mexico – little agreement between model results and expert opinion, with the latter assessing the situation much less degraded;
  • Morocco – both model and experts sketch a mixed picture of land degradation, with a striking level of agreement;
  • Spain – although both methods emphasize intermediate classes of land degradation, the model is on this account more optimistic than the experts;
  • Tunisia – experts consider over 70% as severely degraded, whereas the model assesses 70% as very little degraded;
  • Turkey (Eskişehir) – again a striking agreement between model and expert opinion, and a severely degraded site;
  • Turkey (Karapinar) – little agreement, with experts noting severe land degradation and the model missing any degradation problem (as is briefly discussed above).

The Tunisian site is the most arid, followed by the Spanish and Turkish sites, which overall seem to have more severe land degradation in expert opinion than model assessment. It could be that low levels of vegetation typical for those more arid conditions influence the experts, or that PESERA is too sensitive to slope angle in comparison to plant cover.


Technology scenarios
The effectiveness and financial viability of a total of 22 technologies were simulated in the combined study sites. As Table 1 shows, structural measures (n=8) were the most common, followed by agronomic measures (7), management measures (5) and vegetative measures (2). In order to include technologies, availability of experimental data (»Local field experiment results and conclusions) was in many cases a requirement to understand the functioning and effectiveness of the technology and to calibrate PESERA to local site conditions.  


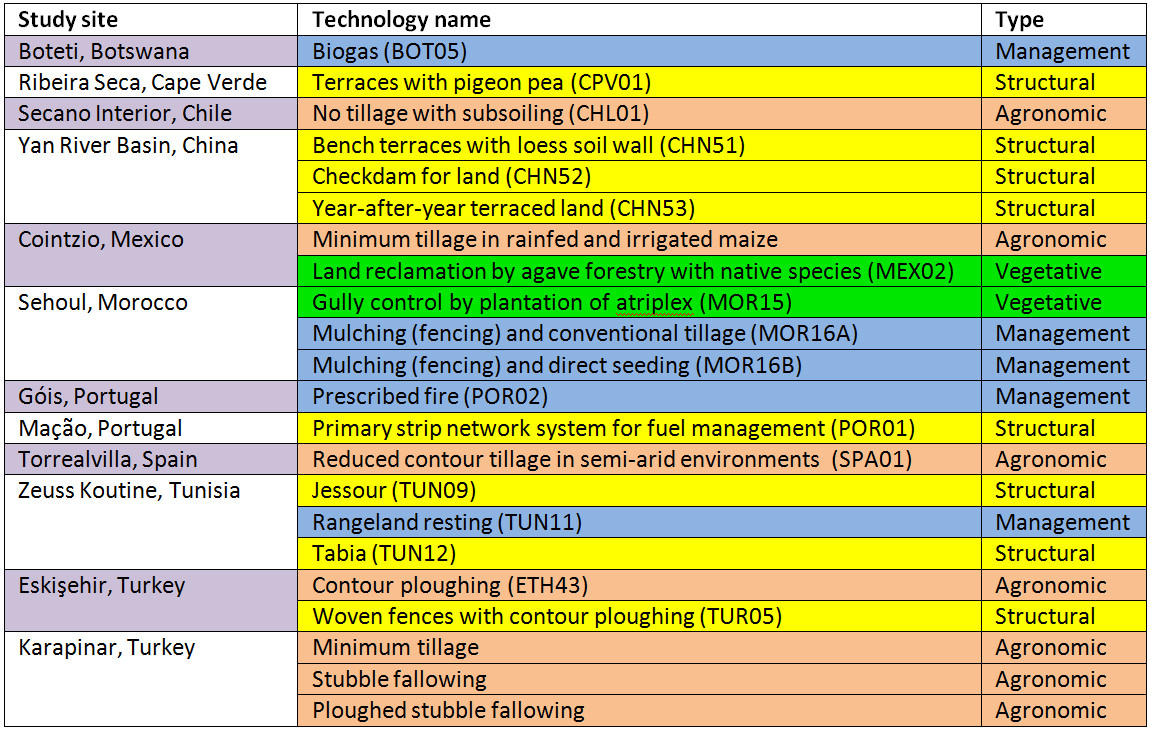
Table 1: Overview of technologies in each study site for which PESERA-DESMICE simulations were run and their classification according to main WOCAT categories: agronomic, management, structural & vegetative.


When classifying the simulated technologies according to the type of measure, a gradient of increasing cost of investment can be observed going from Agronomic < Management < Structural measures ≈ Vegetative (Figure 4A). Agronomic measures were very cheap and in one case actually presented a cost saving (range  -€30 - €79 per ha); they can be incorporated in the annual crop production cycle and are confined to application on arable land. Management measures are more versatile and included a variety of technologies ranging from biogas to prescribed fire for fire prevention and controlling access to fields or rangelands. They typically command an investment analysis as benefits tend to accrue in the medium to long term. The same holds for structural measures. Variability in investment costs was high in this category due to the inclusion of some expensive structures (e.g. checkdams for land - China). Vegetative measures were surprisingly the most expensive category. Although only consisting of a non-representative sample size of two technologies, one could generalize and say that due to their implementation in restoration activities, large investments were required and in order to enable seedlings to survive additional management and structural measures are also used.   


Figure 4: Investment costs (a), applicability limitations (b) and financial viability (c) of different types of measures.


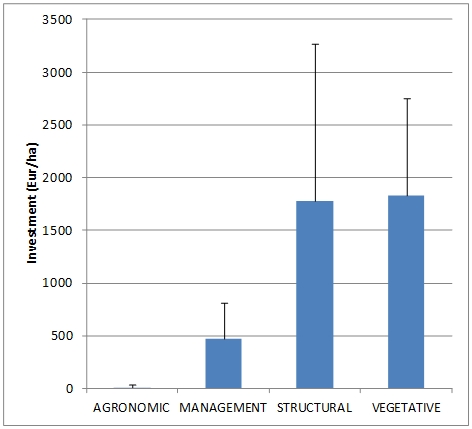
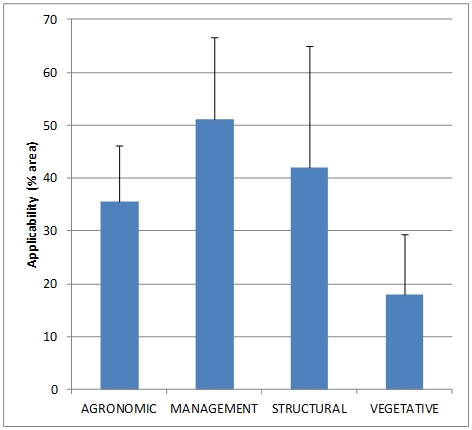
Next, we verified that for technologies modelled (under widely variable circumstances), most frequently about half of the study site can be treated due to applicability limitations. However, in some cases this is considerably less (checkdams for land – China: 9%; gully control by planting atriplex – Morocco: 10%) or more (terraces with pigeon peas – Cape Verde: 76%; rangeland resting – Tunisia: 69%). When aggregating per type of measures, management measures seem to have the widest range of applicability, followed by structural and agronomic measures (Figure 4B). It is suggested that vegetative measures typically demand more specific conditions and are consequently not as widely applicable.


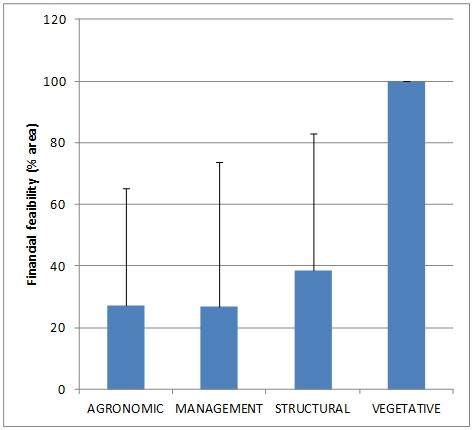
Within applicable areas, many technologies are not profitable in about 70% of the area. Figure 4C shows aggregated financial feasibility of the technologies considered. This figure needs to be interpreted with caution as many factors come into play. For agronomic measures, effectiveness is an important factor. Yields may not respond or even be negatively affected, rendering the technology uneconomic despite low cost. For management measures, their versatile nature makes that although they are widely applicable, they are not universally financially sustainable. Together with structural measures, another factor with large influence is the time horizon after which the technology is evaluated. Some examples are included of measures that are not profitable after 10 years, but very profitable after 20 years. For structural measures, another factor that contributes to mixed financial performance is their sometimes very high investment cost. For the two vegetative measures, which are shown to be attractive in 100% of their applicability area, one should not forget that this is on a limited area – i.e. they may be highly specialized measures.  More importantly however, the without case is unproductive in these cases, and the fact that plants need to grow to maturity means that the right time to evaluate the measure may be more easily determined.
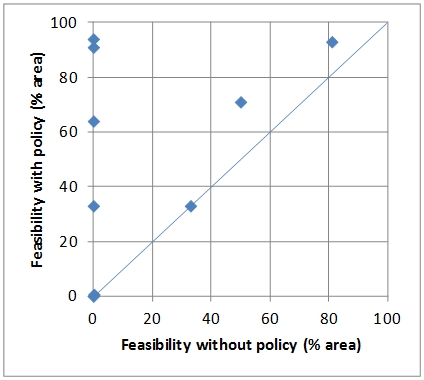
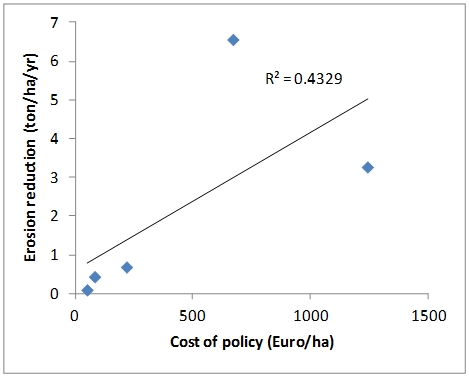
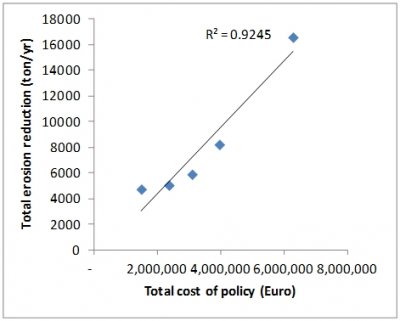
 

Policy scenarios
A total of 11 policy scenarios were run for 8 different sites, of which this section provides a brief overview. The first question we can ask is whether policies contributed to the aim to facilitate upscaling of desertification remediation options. Figure 5A shows a large spread in feasibility of technologies under situations with and without policy interventions. The 1:1 line is the no-effect line and usually one expects only the area above the line to be populated; the larger the distance to this line the more effective a policy is. The chart shows that in a few instances, policies do not result in increased feasibility. On two occasions, there are slight improvements of an already quite high feasibility, e.g. from 81 to 93%. In the remaining cases, an unprofitable technology is raised to being feasible in between 33 and 94% of the applicable area.     

Comparing the per area unit costs of technologies with their effectiveness in reducing soil erosion, from a sample of policy scenarios for which cost data was available (n=5), a general trend of increasing effectiveness with increasing cost can be observed (Figure 5B).  A much better correlation was found between total cost of a policy and its effectiveness in reducing soil erosion (Figure 8C). The difference between the two charts is that in the first instance, the area aspect relates to the cost of (subsidies towards implementation of) technologies on a per hectare basis, whereas in the second case the total cost of a policy can be high because of a large applicability area.


Figure 5: a) Effectiveness of policy scenarios on feasibility of technologies; b) per unit cost-efficiency of policy measures assessed; and c) total cost-efficiency of policy measures assessed.


Global scenarios
Figures 6 and 7 respectively show results of cross-site analyses of opportunities for increased food production and reduced soil erosion. Turning first to the food production scenario, average potential yield increase ranges from less than 50 kg/ha to more than 3000 kg/ha (Figure 6A). However, in three quarters of the study sites, productivity can increase by more than 500 kg/ha. In half of the cases where increased food production is possible, improvements can cover the lion share of the applicability area (Figure 6B). In all sites, yield increases can be obtained in more than 20% of the applicable area. The investment costs required to achieve this are substantial when looking at the first year (Figure 6C, n=12, average cost €567/ton when one case with ‘cost’ below zero is excluded), but are reduced when aggregating over the economic life of technologies (Figure 6D, n=9, average cost €145/ton).


Figure 6A-D: Results for cross-site comparison of food production scenario


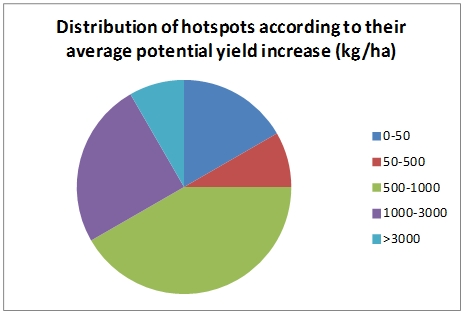
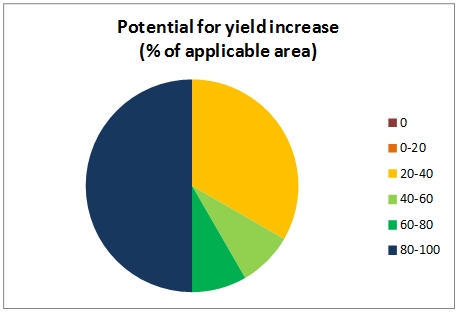
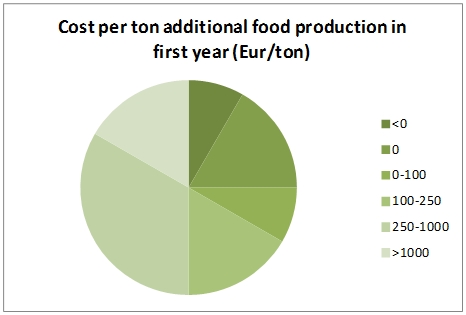
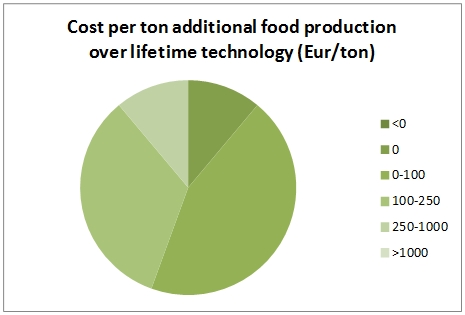
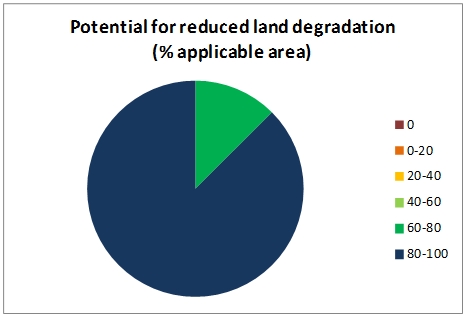
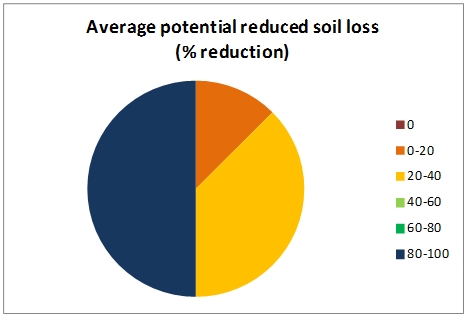
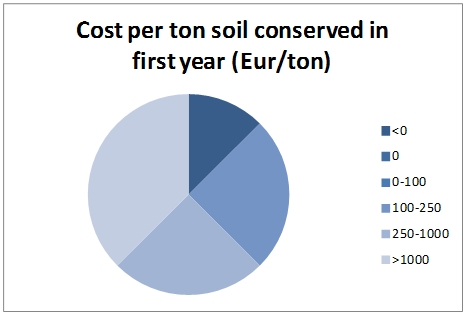
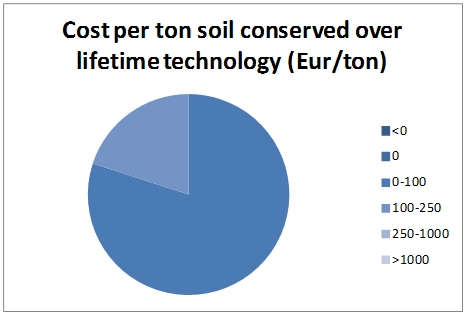
Opportunities to reduce land degradation exist universally across applicability areas: at minimum, soil can be conserved by the technologies assessed on 70% of the applicable area. The rate by which soil loss can be reduced is either very high (80-100%) or moderate (0-40% reduction). In some cases, there are no additional costs involved to reduce soil loss, in others substantial investments (>€1000/ton) need to be made if analyses are done on a single year of erosion reduction. When spread out over the lifetime of technologies, erosion reduction becomes much more affordable, at rates often below €250/ton and in a considerable number of cases below €100/ton.


Figure 7A-D: Results for cross-site comparison of minimizing land degradation scenario.

 
WP3_1_Santiago_3.jpg.jpg

Acknowledgement

fp6 logo 3 50 x 43
The DESIRE project was 
co-funded by the
European Commission,
Global Change and
Ecosystem.
DESIRE brought together the expertise of
26 international research institutes
and non-governmental organisations.
This website does not necessarily
represent the opinion of the
European Commission. The European
Commission is not responsible for
any use that might be made of the
information contained herein.

Follow us