|
Spatial extent of degradation and conservation in DESIRE study sites |
 |
|
Authors: Godert WJ van Lynden, Stephan Mantel (ISRIC - World Soil Information), Rudi Hessel (Alterra)
Two parallel and complementary methods were used to map the extent of desertification and restoration measures in the study areas:
- The WOCAT mapping method, based on participatory assessment;
- The GLADA mapping method, using NDVI analysis of a 26 year time series as has been applied in the LADA project.
WOCAT mapping method (sample results)
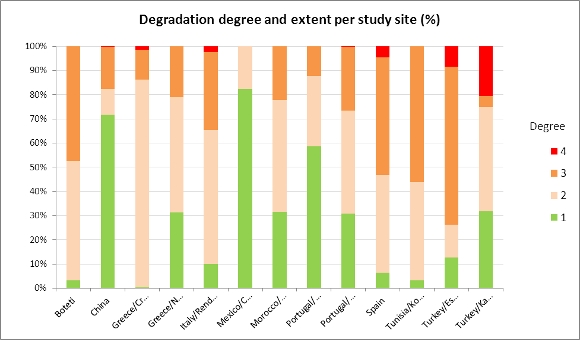
1. Degree and extent of degradation in study sites
 |
 |
| The graph shows that moderate and high degrees of degradaton are fairly common in most sites, but that some sites (e.g. Botswana, Spain, Tunisia, Turkey) are affected by more serious degradation than others. |
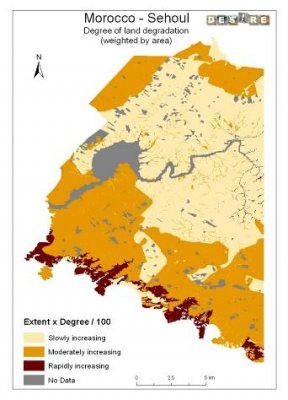
Example land degradation map from the Morocco study site. |
2. Extent and effectiveness of conservation measures in study sites
 |
 |
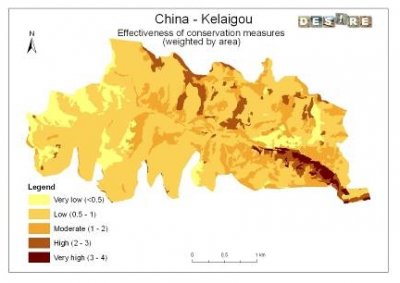
| On average, conservation measures are moderately to highly effective in most sites. Exceptions are Crete (Greece), Rendina (Italy) and Mação (Portugal) where effectiveness is low. |
Example conservation effectiveness map from the China study site |
GLADA mapping method (sample results)
 |
 |
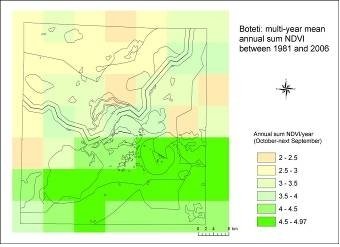
| Long term loss of ecosystem function and productivity is an important indicator of land degradation and desertification, and can be measured by a change in net primary productivity. As a proxy, the remotely sensed normalized difference vegetation index (NDVI) has been shown to be related to biophysical variables that control vegetation productivity. A simple annual sum NDVI indicator was calculated for the complete grwoing season. The positive trend shows in the above graph shwos that (for Botswana) there has been an increase in green biomass for the period 1981-2006, however this does not necessarily also correspond with land improvement. |
|


