Major degradation issues due to the use of natural resources - methodologies
Among the most important land degradation processes are . Soil erosion is a natural process associated with rainstorms and gully and rill formations, but its rate has been greatly accelerated by human activity, primarily agricultural tillage and grazing pressure. Soil salinisation is the accumulation of natural and artificial salts in the soil and water. Soil and water salinisation is attributed to: (a) dryland salinisation where soil near the surface can become more saline as salts are drawn up in solution from a raised water-table, (b) irrigation salinisation occurring when irrigation water contains dissolved salts, and (c) intrusion of sea water into coastal aquifer.The analysis of the land degradation and desertification attributed to these processes were based on: (a) the assessment of soil erosion risk using the PESERA model and field survey estimations, (b) the assessment of soil salinization risk based on the DESERTLINKS methodology, and (b) the definition of environmentally sensitive areas to desertification using the methodology defined by MEDALUS III research project. Water stress was assessed using the climatic data and soil characteristics.
Soil erosion assessment
Soil erosion was assessed by: (a) using the PESERA model, and (b) describing the degree of soil erosion in field survey. The PESERA (Pan - European Soil Erosion Risk Assessment) model (Kirkby, 1999; Kirkby et al., 2000) has been developed to be used as a regional diagnostic tool for predicting soil erosion rates under various land use types, soil, and landscape characteristics. PESERA is a physically based soil erosion model built around conceptual separation of precipitation into overland flow runoff generation and infiltration, with a runoff threshold depending primarily on soil and vegetation properties. Sediment transport is estimated from runoff totals in each storm, and represents the processes of sheet wash and rill wash, which are the dominant processes in severe soil erosion loss. Other active processes, including tillage erosion and rain-splash, are not considered in the model because these processes do not generally produce conditions for severe erosion losses.
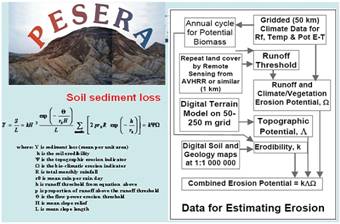
The model estimates erosion by identifying three components respectively derived from climate and vegetation, topography and soil factors (Figure 13). For each of these components widely available data are used in order to make regional forecasts. Because climate and land use are explicit drivers in the model, PESERA may also be used to assess sensitivity to change conditions.
The amount of sediments transported after each rainfall event is estimated as a mean soil loss in tons ha-1, obtained as a product of the three components for climate and, vegetation, topography and soil given by the equation (Kirkby 1999) (Figure 13)
Figure 13: Basic components of PESERA model for assessing soil erosion rates (Kirkby, 1999)
Erosion is estimated using data on daily climate, soils, topography and land use which are combined in a physically based model. The first term, k, is based on properties derived from soil mapping. The second term Ψ, for relief, is estimated as the standard deviation of elevation within a given radius from a DEM of the topography. The third term Ω is computed from climate (to give the rainfall distribution), vegetation cover or land use and soils (to give the runoff threshold).
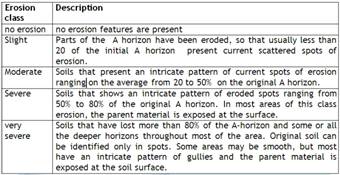
The present situation of degree of soil erosion has been characterised, according to: (i) the presence or not of the A-horizon, (ii) the existence and percentage of eroded spots, (iii) the degree of exposure of the parent material on the soil surface, and (iv) the presence of erosional gullies. Five classes of degree of erosion can be distinguished, very severe, severe, moderate, slight, and no erosion. The degree of soil erosion is described using the following table:
Soil salinization risk
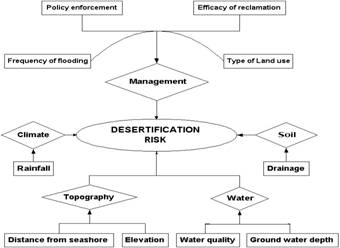
Salt-affected areas are mainly located in lowlands along the coastal lines. Such areas are very sensitive to desertification due to salinization under specific land and management characteristics. The desertification risk due to soil salinization was assessed using the DESERTLINKS methodology defined for such areas. This methodology is based on a series of indicators related to land management, climate and soil characteristics, topography and water quality (Figure 14).
Figure 14: Indicators related to desertification risk in salt-affected areas (Kosmas et al., 2003)
Analysis of water stress
Water stress is one of the main factors affecting plant growth and stage of vegetation degradation in the study areas of Crete. Water stress is defined by the following parameters affecting water stress: (a) air temperature, (b) precipitation, (c) evapotranspiration, (d) rainfall seasonality, (e) Bagnouls-Gaussen aridity index (BGI), and (f) soil water storage capacity. Data on air temperature and precipitation were provided by the meteorological stations located in or nearby the study areas. Evapotranspiration was calculated using the Penman-Monteith method as modified by Allen (1986). Rainfall seasonality was calculated by the Seasonality Index (SI) (derived by Walsh and Lawler (1981) estimated by the following equation:
![]()
Where Ri is the total annual precipitation for the particular year under study and Xin is the actual monthly precipitation for month n. The rainfall seasonality can be assessed by using the following SI index.
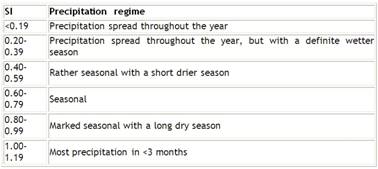
The aridity index classifies the type of climate in relation to water availability. The higher the aridity index of a region the greater the water resources variability and scarcity in time, the more vulnerable the area to desertification The Bagnouls-Gaussen aridity index (BGI) was calculated using the following equation:
![]()
Where: ti is the mean air temperature for month i in 0°C, Pi is the total precipitation for month i in mm; and k represents the proportion of month during which 2ti - Pi >0. Then the aridity index is classified as following:

Soil water storage capacity was estimated by using the soil map of the studied areas. Soil water storage capacity corresponds to the amount of water which can be stored into the soil. It refers to the amount of water which is available for the plant growth. If this water content becomes to low, plants become stressed. The plant available moisture storage capacity of a soil provides a buffer which determines a plant's capacity to withstand dry conditions. Available water is the amount of the water held in a soil between field capacity and permanent wilting point. Evapotranspiration is the rate a crop uses water for transpiration plus evaporation from the soil surface. Based on the soil map and laboratory measurements of soil water characteristics such as field capacity and wilting point of representative soil samples collected from various soils and soil horizons, the water storage capacity was estimated for the studied areas. The maximum rooting depth considered here was either 120 cm or the depth to the consolidated parent material in case of soils with thickness less than 120 cm.
Defining environmentally sensitive areas to desertification
The environmentally sensitive areas (ESAs) to desertification has been defined using the methodology developed in the EU research project MEDALUS III (Mediterranean Desertification and Land Use). Environmentally Sensitive Areas (ESAs) to desertification around the Mediterranean region exhibit different sensitivity to desertification for various reasons. (Kosmas et al., 1999). For example there are areas presenting high sensitivity to low rainfall and extreme events due to low vegetation cover, low resistance of vegetation to drought, steep slopes, highly erodible parent materials, etc. High sensitivity can be also related to the type of land use, since land use can promote desertification in climatically and topographically marginal areas. Four general types of ESAs have been distinguished based on the stage of land degradation (Kosmas et al., 1999), (a) critical, (b) fragile, (c) potential, and (d) non-threatened.
The various types of ESAs to desertification have been distinguished and mapped by using certain key indicators or parameters for assessing the land capability to withstand further degradation, or the land suitability for supporting specific types of land use. A simple methodology has been developed by Kosmas et al. (1999) to identify ESAs to desertification by using 15 simple indicators related to soil, climate, vegetation, and land management characteristics. After the definition of classes and the assignment of weighing indices for each indicator, soil, climate, vegetation and management qualities are defined by combination the various indicators. Then the ESAs were identified based on these qualities.
Soil and vegetation data collection
Soil, vegetation and land management data for the Chania region were collected during the execution of the research projects: OLIVERO, DESERTLINKS, and IMAGE. Soil data for the lower Messara valley were taken from the soil survey conducted by the Greek Nuclear Research Center Democritus (Yassoglou, 1971). Soil, vegetation, and land management data for north part of the study area of Messara (14,513.7 hectares) were collected for the DESIRE project.
A semi-detailed soil survey was conducted in the research area of Messara valley (scale 1:30.000). The following parameters were described soil texture of the surface horizon, drainage conditions, presence of rock fragments, depth to bedrock, degree and direction of soil development, slope gradient, slope aspect, degree of soil erosion, and parent material. These land parameters were studied in a dense network of 340 field observations and were recorded on each mapping unit. The boundaries of the mapping units were drawn on aerial photographs supplied by the Geographical Service of the Greek Army.
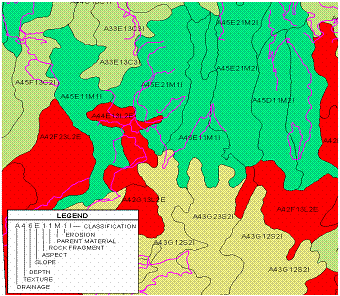
In particular, the soil textural classes were defined according the USDA system (Soil Survey Staff, 1975), and were grouped into the following textural classes: very coarse (S, LS), coarse (SL), medium (L, SiL, Si), moderately fine (SCL, CL, SiCL) and fine (SC, C, SiC) (Table 4). The parent material was defined according to the geological map of the area (scale 1:50,000) supplied by the Greek National Institute of Geology and Mineral Exploitation (IGME). The main parent materials mapped in the study area were marl, shale, limestone, conglomerates, flysch and alluvial deposits. Soil depth to unconsolidated bedrock was measured in auger holes or in cuts. The following classes were used: very shallow (depth 0-15 cm), shallow (15-30 cm), moderately shallow (30-60 cm), moderately deep (60-100), deep (100-150 cm) and very deep ( >150 cm). Slope gradient was described using the topographic maps. The soils were classified according to the Soil Taxonomy (Soil Survey Staff, 1975) into three broad categories (Soil Orders), viz. Entisols, Inceptisols, and Alfisols. The degree of erosion was assessed qualitatively and semi-quantitatively during the execution of the soil survey as described above. These parameters were described and presented in the symbol of mapping unit (Figure 15).
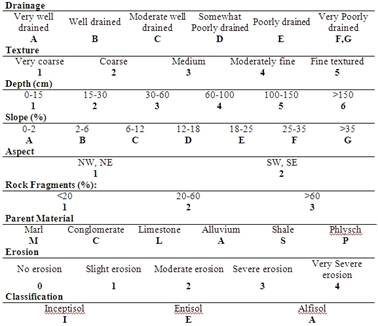
Table 4: Parameters with corresponding classes used for mapping soils
Vegetation was mapped on the basis of the dominant species such as Olives, vines, citrus, annuals, shrubs (Quercus sp, Erica sp, Pistacia sp., etc.), pines, deciduous oak, and bare land. The percentage cover by each type of vegetation was defined in classes by aerial ortho-photo-interpretation and field survey at a scale of 1:30,000. The following classes of plant cover were used: <25%, 25-50%, 50-75% and >75. Each vegetation unit, presenting in the corresponding mapping unit, usually includes more than one of the dominant species mentioned above. Therefore, vegetation type and percentage cover was included in the vegetation map.
Figure 15: Soil map showing the boundaries and the symbols of the various mapping units
The boundaries of each mapping unit was drawing on ortho-photo maps and the type of vegetation and the percentage cover was identified by: (a) using the ERDAS image analysis software and (b) ground data collected on a field survey. Then the data were introduced on ArcGIS (edition 9) for further analysis of the various mapping units of the area and the final vegetation map was compiled.
