| Desertification risk assessment maps |
 |
|
Source: extracted from Karavitis, C., Kosmas, C. et al. (submitted article) An expert system towards assessing desertification risk using indicators. Environmental Management
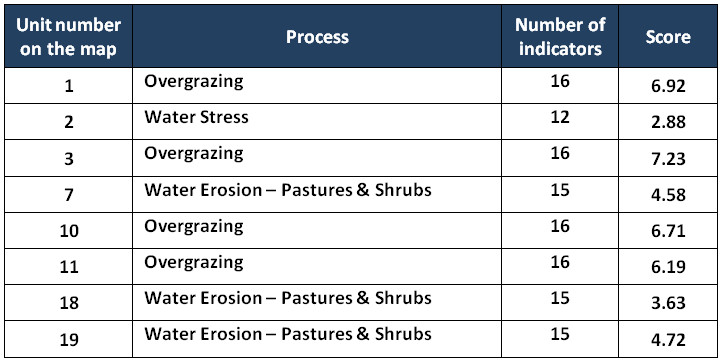
For these processes the Desertification Risk Assessment Tool required the input of data to calculate 130 indicators in 9 map units. This data was obtained from the WOCAT database. The procedure was applied to all the map units in the Dzhanibek study site and the DRI values calculated are shown in Table 1.
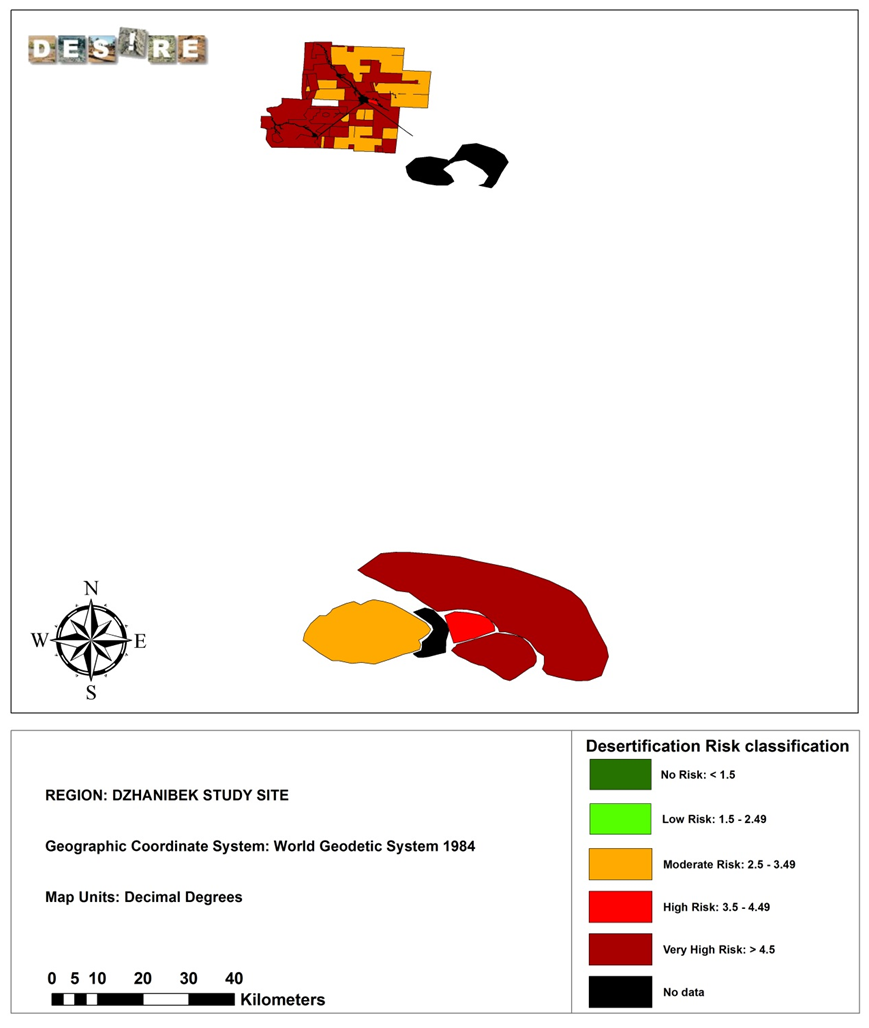
The DRI values were mapped for each of the 9 polygons (Map 1)
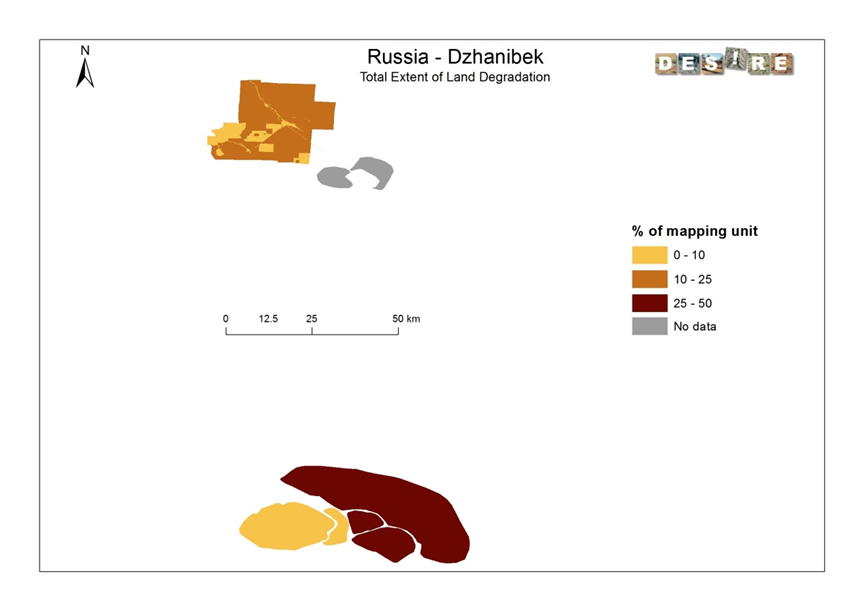
The DRI map was compared with the WOCAT QM of the same area (Map 2). It can be seen that the rate of degradation and the measures' effectiveness seen in the WOCAT map correspond closely to the DRI values, with the highest rate of degradation and the lowest measures effectiveness matching up to the highest values of DRI.
|
Study sites
Acknowledgement
The DESIRE project was
|
DESIRE brought together the expertise of
26 international research institutes
and non-governmental organisations.
This website does not necessarily
represent the opinion of the
European Commission. The European
Commission is not responsible for
any use that might be made of the
information contained herein.