WOCAT mapping
Together with individual case studies documented within WB3, this map will also show areas where protection and restoration measures have been applied and with what degree of success. This assessment will enable us to put the study sites in a broader environmental and socio-economic context. There are many environmental and socio-economic factors that influence the occurrence and expansion of land degradation, as well as the rate of success of mitigating measures. These factors will be identified at the local level (field sites) and their relevance for application at regional level will be assessed. They will serve as input parameters for an appropriate model to incorporate and apply them in the search for solutions (see WBs 4 & 5).
The "WOCAT" method used to map degradation and conservation in the study sites complements the study site descriptions provided by the individual study sites and was based on the original WOCAT mapping questionnaire (WOCAT, 2007), which was significantly revised in a joint effort of DESIRE, WOCAT and LADA in order to pay more attention to issues like biological and water degradation and placing more emphasis on direct and socio-economic causes of these phenomena and impacts on eco-system services. It evaluates what type of land degradation is actually happening where and why, and what is done about it in terms of Sustainable Land Management (SLM). Linking the information obtained through the questionnaire to a Geographical Information System (GIS) permits the production of maps as well as area calculations on various aspects of land degradation and conservation. The on-line map database is hosted by WOCAT, and the mapped outputs that can be generated from this database provide a powerful tool to obtain an overview of land degradation and conservation in a country, a region, or worldwide.
The mapping method consists of a spatial assessment of individual mapping units of a predefined base map, through the use of a questionnaire. The starting point for mapping degradation and conservation is land use. This is one of the main drivers of degradation / conservation and the basis for identifying the mapping units for which subsequently the information on land degradation and conservation was filled in. A hierarchical system for defining LUS-mapping units was used. Information that is contained in each specific unit will be displayed in the online system and contains the mapping unit delineations and a number of optional ecosystem and socio-economic attributes. The following steps were followed to delineate the base map units.
- First, the main Land Use Type was delineated, e.g. Cropland, Grazing land, Forest/woodland, Mixed, or Other.
- These main Land Use Types were subdivided: e.g. for Cropland: annual, perennial cropping; extensive or intensive Grazing land, etc.
- Further subdivisions, if needed and sensible, were made on basis of physiographic or geomorphologic criteria, administrative units or socio-economic criteria
The Study Site leaders were left some degree of autonomy in their choice of additional criteria, which has resulted in base maps with slightly varying land use definitions (see maps I).
A base map unit is not necessarily confined to a single closed polygon, but may include many larger and smaller polygons, together forming a map unit for which degradation and conservation is assessed. The sizes/ scales of the different study sites vary between several km² and several hundred km² but on the average in the order of magnitude of 500 km². It was therefore proposed that for the larger study sites one or several representative area(s) - covering an area of up to a few hundred km² - was selected, for which the mapping is carried out. This will help in sharing experiences between the different study sites. Even though the mapping method is scale-independent, the accuracy and level of information of course vary with the scale.
The number of mapping units varies but should be more or less in the same order of magnitude for all study sites. Most study sites have in the order of 30- 50 units for which information was filled on the matrix tables. The size of the study area and the variability within the area will determine the scale of the mapping exercise and the size of the mapping units.
The base map was to be provided in a shapefile format to CDE (DESIRE partner 5) which is hosting the WOCAT database, where the DESIRE mapping data are also stored. The shapefile was entered into the system after which contributors could enter the attribute information in the on-line database system which has also been developed in a joint WOCAT/DESIRE/LADA effort. A viewer to display maps on-line is still under development at the moment of writing this report.
The mapping attributes on which information had to be collected are laid down in the so-called Questionnaire for Mapping ("QM") and consist of the following blocks: Land use, Degradation and Conservation/SLM). The information on degradation and conservation is more or less "mirrored", as shown in table 1 below.
The collected data are largely qualitative, based on expert opinion and consultation of land users. This permitted a fairly rapid and general assessment of the spatial extent, status and trend of degradation and extent, effectiveness and impact of SLM as well as their drivers.
| Degradation / Mapping unit | SLM / Mapping unit |
| Type | Name / Group / Measure |
| Extent (area) | Extent (area) |
| Degree | Effectiveness |
| Impact on ecosystem services (type and level) | Impact on ecosystem services (type and level) |
| Direct causes | |
| Indirect causes | Degradation addressed |
| Recommendation |
The information collected allows a wealth of different map outputs to be prepared, of which a few examples are given below in Annex I. For instance, the extent of degradation in general or of specific types can be displayed, as well as their impact on Ecosystems (in the enclosed maps only the occurrence of main degradation types is shown for four sites and the extent of (all) degradation for two other sites). Similarly, Conservation types and their effectiveness, as well as their impact on ecosystems can be shown. Both conservation and degradation can simultaneously have positive effects on some ecosystems and negative effects on others. Normally the balance would be negative for degradation and positive for conservation.
Results
The mapping database contains a wealth of attribute information, which cannot be shown in its entirety in the context of this report. Therefore examples of some maps are provided in Annex I, as well as the result of some area calculations below, showing tables and graphs on the extent of degradation and conservation. The full dataset is available on the DESIRE Website and can be used to create user-defined maps.
Furthermore, attribute data were analysed and graphs created for the area coverage of different land use types, degradation and conservation features. Some results are shown below for all study sites combined (except for the land use component, since different land use classes were used in the different study sites, so a generalised overview is not possible). Similar analyses have been made for the individual study sites.
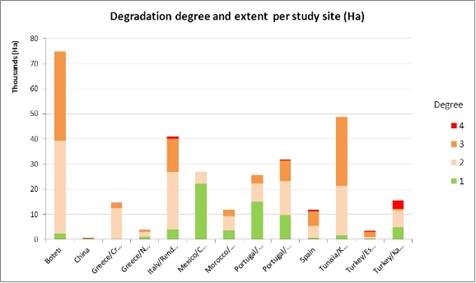
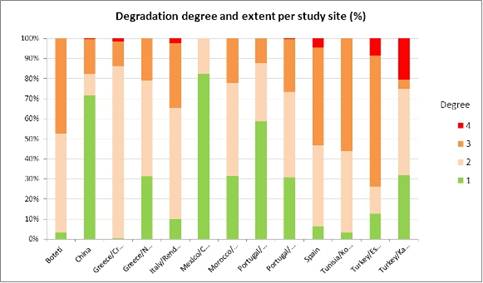
Degradation degree and extent per study site (both in area coverage and as percentage of the study site area): The study site areas cover quite a range in size and therefore the relative graph (expressed in %) is better suited for comparison. It also shows that moderate and high degree (2 and 3) of degradation is fairly common in most sites, but that some sites are affected by more serious degradation (higher degree), e.g. Botswana, Spain, Tunisia, Turkey, than others, e.g. China, Mexico or Portual (Gois). The distribution of individual degradation types per study site is too diverse to show in a generalised table or graph and is therefore given in the individual study site data.
 |
 |
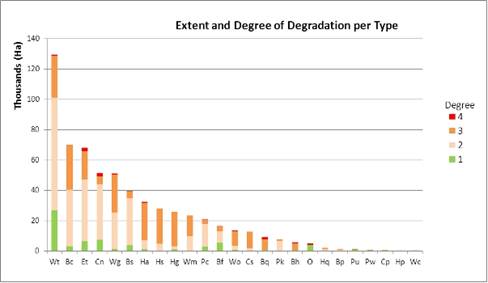
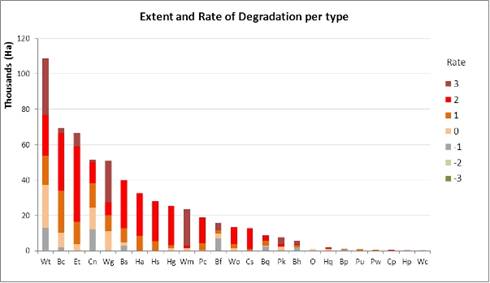
Degradation Degree and Rate per degradation type: This clearly shows that sheet erosion by water (Wt) is the most common type of degradation on average, closely followed by biological degradation (Bc: Reduction of vegetation cover) and Wind erosion (Et), soil fertility decline (Cn) and gully erosion (Wg). Again moderate to high degree of degradation is predominant for most degradation types, but with a remarkable exception for various types water degradation (H), with mostly high degrees.
All degradation types show an average positive rate of degradation for all study sites together, hence an increasing trend.
 |
 |
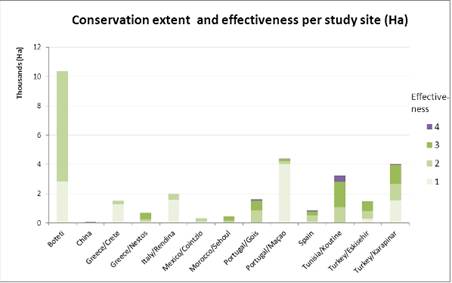
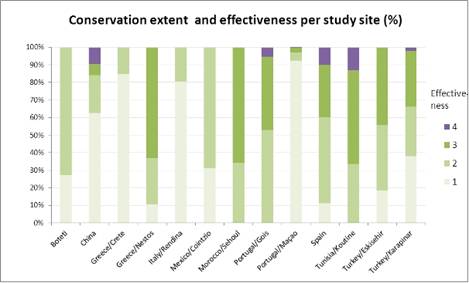
The extent and effectiveness of conservation per study site, in Ha. (both in area coverage and as percentage of the study site area). As with degradation, the percentage graph is better suited for comparison between the sites. The (average) effectiveness in most sites ranges from moderate (2) to high (3), with the exception of Crete (Greece) and Rendina (Italy) and Maçao (Portugal) where effectiveness is relatively low (1 -2).
 |
 |
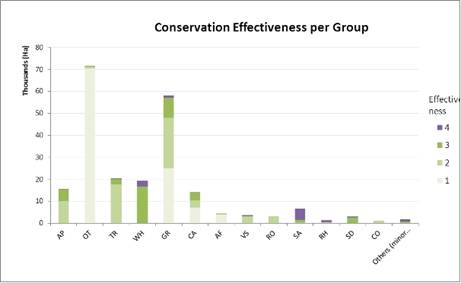
The effectiveness of conservation and its trend per conservation group: This shows firstly that (in four of the sites) many conservation measures have been ranked under the group "Other", indicating that the current grouping system may still need some further refinement or more explanation. For the other measures the effectiveness is generally ranked moderate (2) to high (3). The effectiveness trend shows a stable to slightly increasing effectiveness for most conservation measures, but some negative trend too for Grazing land management (GR) and for "Other".
 |
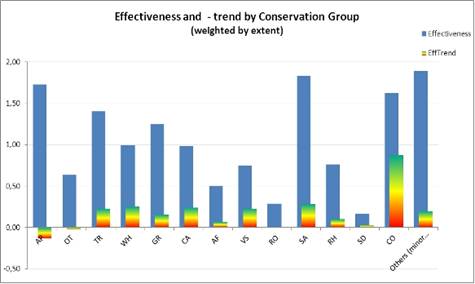 |
Conservation Groups
| AP | Afforestation and forest protection |
| OT | Other |
| TR | Terraces (structural, but often combined with vegetative and agronomic measures) |
| WH | Water harvesting (structural, but also combined) |
| GR | Grazing land management (management practices with associated vegetative and agronomic measures) |
| CA | Conservation agriculture / mulching (mainly agronomic measures): |
| AF | Agroforestry (mainly vegetative, combined with agronomic) |
| VS | Vegetative strips / cover (mainly vegetative measures): |
| RO | Rotational system / shifting cultivation / fallow /slash and burn |
| SA | Groundwater / salinity regulation / water use efficiency |
| RH | Gully control / rehabilitation (structural combined with vegetative) |
| SD | Sand dune stabilization: (vegetative, structural and management) |
| CO | Conservation of natural biodiversity: Conservation of natural ecosystems and processes and the conservation of rare and endangered species. |
The database contains much more information that is worth analysing (direct and indirect causes, impact on ecosystems) but not all results can be shown here.
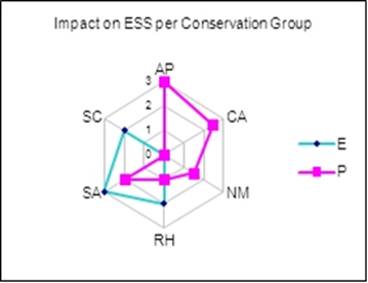
Spider (or radar) charts are best suited to show the various impacts on ecosystems where degradation (or conservation) may have a negative impact on some but a positive impact on other ecosystems at the same time (see example).
An interactive GIS-like map viewer is still under development but simple pre-defined maps (as shown in Annex I) are already provided as JPGs on the Website. Users with GIS facilities can download basemap shapefiles and attribute data and hence create their own custom maps.