GLADA mapping
Are the DESIRE sites browning or greening?
(by Zhanguo Bai)
The long-term loss of ecosystem function and productivity can be considered an important indicator of land degradation/desertification (Bai et al., 2008). It can be measured by change in net primary productivity (NPP - the rate at which vegetation fixes CO2 from the atmosphere less losses through respiration) where deviation from the norm may be taken as an indicator of land degradation/desertification or improvement. As a proxy, the remotely sensed normalized difference vegetation index (NDVI, calculated from a normalized transform of the near-infrared (NIR) and red reflectance ratio) has been shown to be related to biophysical variables that control vegetation productivity (Bai et al., 2008).
The GIMMS (Global Inventory Modelling and Mapping Studies) NDVI dataset (Version G, Pinzon et al., 2007) has been used in the LADA project to reveal the greenness evolution for six pilot countries and globally. The GIMMS dataset consists of NDVI data from 1981 through 2006, summarized fortnightly at 8 km resolution. The Harmonic Analysis of NDVI Time-Series (HANTS) algorithm (Verhoef et al., 1996, Roerink et al., 2000) was used to remove any residual cloud effects or other outliers (Jong de et al., 2009). The harmonized GIMMS NDVI time series 1981-2006 were used in an analysis of the DESIRE study sites.
 |
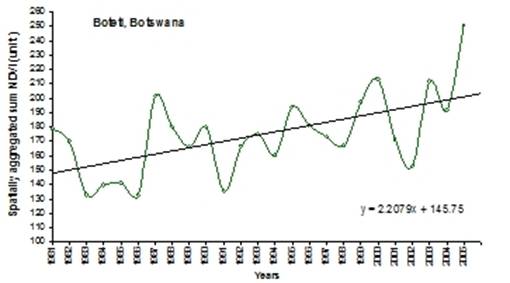 |
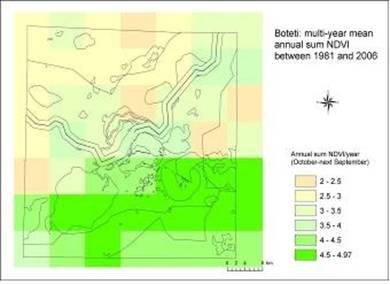
Figure 11: Average greenness over the growing season from 1981 - 2006 in the Botswana study site |
Figure 12: Trend in greenness from 1981 - 2006 depicted by the slope of the linear regression |
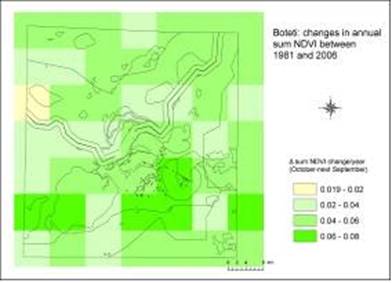
A simple annual sum NDVI indicator was computed pixel-by-pixel for the calendar year for the countries in the northern hemisphere, and for October to the following September for the countries in the southern hemisphere (Botswana, see examples, and Chile), encompassing a complete growing season; the annual sum NDVI which reflects the aggregate of greenness over the growing season, was used as the standard surrogate for annual biomass productivity (Figure 11). Trends were calculated by linear regression at an annual interval and mapped to depict spatial changes (Figure 12). A negative slope of linear regression indicates a decline of green biomass and a positive slope, an increase. The absolute change (∆ in the map legends, titled "changes in ...", Figure 13) is the slope of the regression; the relative change (% in map legends, titled "trend in ..." - no examples given here) is 100 (slope of the regression/multi-year mean). The significance of trend analysis was set at 95% confidence level using t-test (Figure 14); In addition, SPSS and MS Excel were employed to analyse trends, correlations and significances of the non-gridded variables.
 |
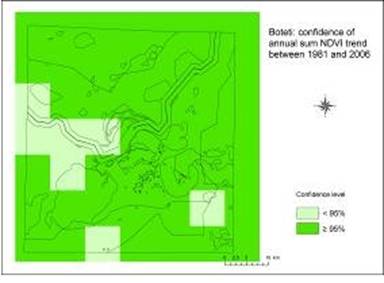 |
Figure 13 Changes in Greeness from 1981-2006 |
Figure 14 Confidence level for Greeness changes from 1981 - 2006 |
NDVI cannot be more than a proxy for greenness of vegetation. A negative trend in NDVI does not necessarily indicate land degradation/desertification, nor does a positive trend necessarily indicate land improvement. Biomass depends on several factors including: climate - especially fluctuations in rainfall, sunshine, and length of growing season; land use; large-scale ecosystem disturbances such as fires; and the global increase in nitrate deposition and atmospheric carbon dioxide. NDVI/NPP is used simply to identify areas where significant biological change is taking place. The trend of NDVI/NPP does not tell us anything about the nature of the changes; what is happening in Botswana is different from what is happening in for instance Mexico, both in terms of the driving changes in land use and the kind of land degradation. Better linkage and interpretation between NDVI/NPP change and land degradation/desertification are needed; comparisons with land cover, soil and terrain, and socio-economic data are recommendable.
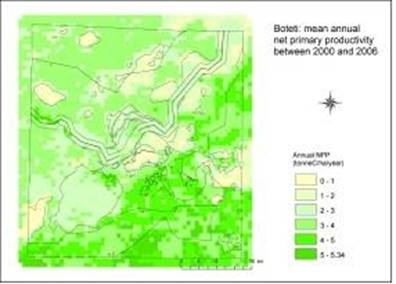
NDVI is simply a ratio of red and near-infrared light reflected by the land surface. To get a measure open to economic analysis, the GIMMS NDVI time series has been translated to NPP using MODIS data (Justice et al., 2002, Running et al., 2004) for the overlapping period 2000-2006 (Figure 15). NPP was estimated by correlation with MODIS 8-day NPP values for the overlapping years of the GIMMS and MODIS datasets (2000-2006), re-sampling the annual mean MODIS NPP at 1km resolution to 8km resolution using nearest-neighbour assignment (Figure 16). This translation is approximate.
 |
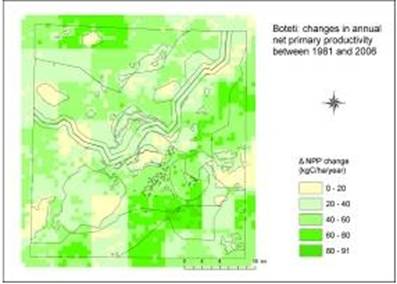 |
Figure 15: MODIS NPP from 2000 - 2006 |
Figure 16: "Translated" NPP from 1981 - 2006 |
Caveat
The 8km resolution of the GIMMS data sets a limitation in two senses. First, an 8km pixel integrates the signal from a wider surrounding area. Many symptoms of even very severe land degradation, such as gullies, rarely extend over such a large area; they must be severe indeed to be seen against the signal of the surrounding unaffected areas. More detailed analysis is possible for those areas that have higher resolution time series data. Secondly, an 8km pixel or even a 1km pixel cannot be checked by a windscreen survey; and a 26-year trend cannot be checked by a single snapshot. In addition, NDVI signal can be saturated at closed vegetation canopy (Ripple, 1985). This means that NDVI is more sensitive for cropland and rangeland than for forest - leading to a lack of precision for forest mapping.
A declining trend of NDVI/NPP, as above-mentioned, even allowing for climatic variability, may not even be reckoned as land degradation: urban development is generally considered to be development - although it brings a loss of ecosystem function; land use change from forest or grassland to cropland of lesser biological productivity may or may not be accompanied by soil erosion, compaction and nutrient depletion - and it may well be sustainable and profitable, depending on management. Similarly, an increasing trend of NPP means greater biological production but may reflect, for instance, bush encroachment in rangeland or cropland - which is not land improvement as commonly understood.
Full sets for the NDVI analysis of all study sites are available on the DESIRE Website.