Annex 1: Map examples from individual study sites
The mapping database contains a wealth of attribute information, which cannot be shown in its entirety in the context of this report. Therefore examples of some maps for (rather randomly) selected study sites are provided below. The full dataset is available on the DESIRE Website and can be used to create user-defined maps. The examples below show:
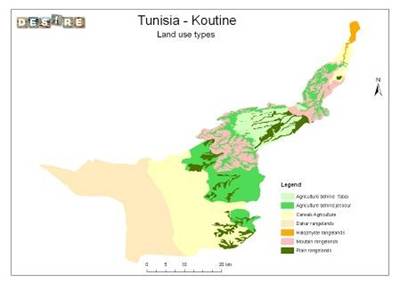
- The different land use types in Tunisia: land use formed the basis for the mapping units used to assess the degradation and conservation attributes;
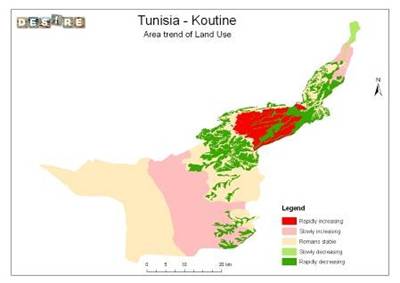
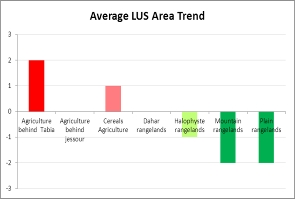
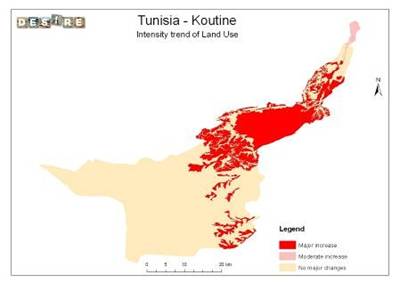
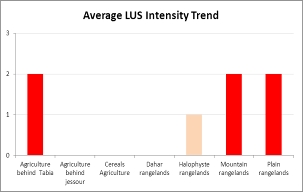
- The Area trend and Intensity trend for these land use types. The Area trend map shows a "rapid increase" in "Agriculture behind Tabia"
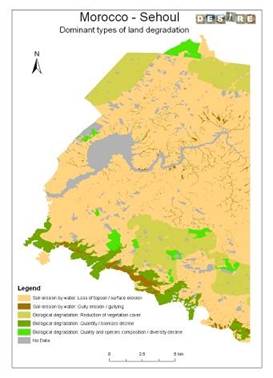
- The main degradation type: within one mapping unit various types of degradation may occur and either or not overlap each other (cover the same area). The degradation types themselves were not delineated on the map, but for each type (or overlapping combination) the percentage of the mapping unit affected was asked. This means that especially in cases of low extent percentages the degradation can be anywhere within the mapping unit (this also applies to conservation measures). The smaller the scale of the map (and hence the smaller the units used), the less this is a problem. It was further assumed that in case of more degradation types per mapping unit, the type with the highest extent was considered the "main" type. Also, in case of combinations (overlapping degradation types), the first one listed was assumed to be the "main" type;
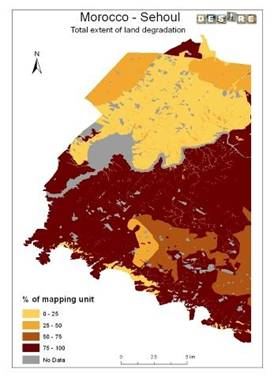
- The extent of degradation: the total percentage of the mapping unit covered by any type of degradation;
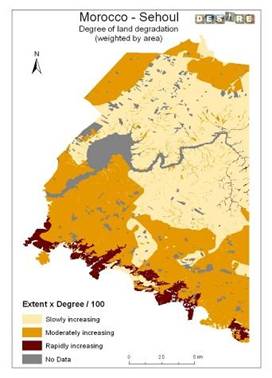
- The degree of degradation, weighted by area: degree multiplied by the extent percentage (e.g. Extent 20%, and Degree =2 ( weighted degree = 0,4). In the case of more degradation types per mapping unit the weighted degrees for these types were added up;
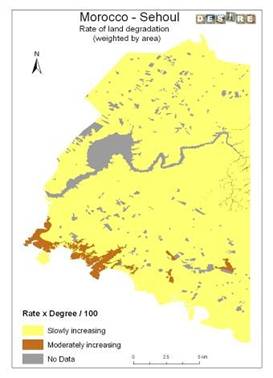
- The rate of degradation, weighted by area;
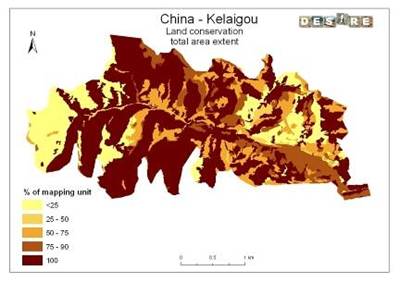
- Total extent of conservation: the total percentage of the mapping unit covered by conservation;
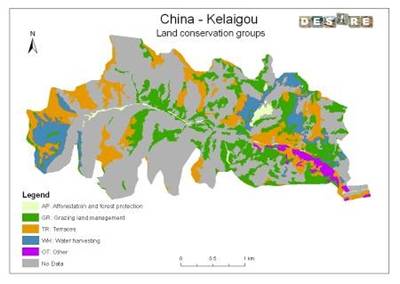
- The main Conservation groups: WOCAT (2007) has made a grouping system reduce the wide range of conservation measures to a more manageable number. As with degradation types, there may be more than one group occurring within a single map unit, in which case the group with the highest extent is displayed;
- Extent of Conservation measures: conservation measures are a further categorisation of the conservation groups by means of the specific practice applied: agronomic, vegetative, structural, or management (including combinations);
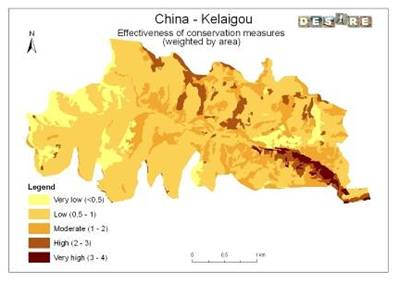
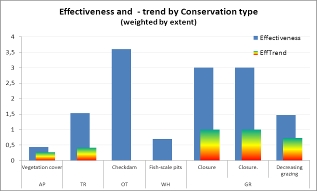
- The effectiveness of conservation: the effectiveness of conservation is expressed in 4 classes from 1 (low: the measures need local adaptation and improvement in order to reduce land degradation to acceptable limits) to 4 (very high: the measures not only control the land degradation problems appropriately, but even improve the situation compared to the situation before degradation occurred). As with degradation degree and rate, the effectiveness is weighed by the extent of that conservation measure so that a conservation measure with effectiveness 3 but with an extent of 5% gets a proportionally lower value than another measure with effectiveness 3 but an extent of 80%.
Land Use
Degradation
Conservation
