|
Author: Victor Jetten
Introduction
Indicator systems are widely used in a context of desertification and are under constant development. DESIRE's rich dataset was used in Research Theme 2 to create an indicator system that calculated the desertification risk index.
The desertification index is a dimensionless value derived for a multivariate analysis over all sites that expresses the degree of desertification, divided into:
- water erosion, on agricultural lands, grass lands/shrub lands and forests
- tillage erosion,
- salinization,
- forest fire,
- water stress,
- overgrazing.
The user selects from a large list of variable the classes that are relevant for the specific situation under investigation, selects the desertification process(es) that are under review. The calculated risk is expressed in a dimensionless value, that has no direct physical meaning but expresses a relative degree of desertification risk that is classified as "no risk" ,"low, "moderate", "high" and "very high" risk.
By calculating the risk for reference sites and for an implemented technology, the assessment tool evaluates if the technology has the intended effect of lowering the risk. There is some interpretation involved to fit a particular situation in the variable classes of the tool. The tool is very versatile, variables that are unknown for a site can be excluded, so it can be adapted to the available data of a site.
The aim of this section of the DESIRE-HIS is to use the experimental results as reported in »Local field experiment results and conclusions in the desertification risk assessment tool, identify bottlenecks and give advice for future development of the tool. However, it is important to realize that the tool is used here out of context: it is not meant to evaluate individual experiments on a field/plot scale as it is based on variables across all sites and also partly based on more regional variables that are not affected at an experimental scale.
Methodology
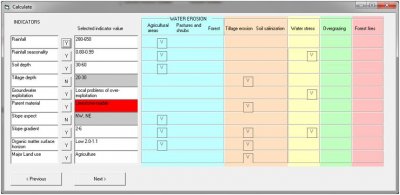
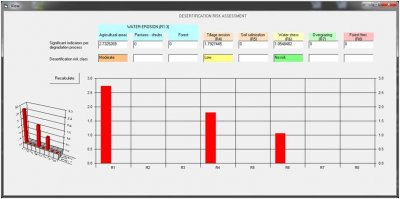
The methodology is simple: for each site the tool has been used to calculate the desertification index of the reference situation. Subsequently all experiments on a site are included and the change of desertification index is noted. This was repeated for all sites.
 |
 |
| Example input and output screens from one of the Guadalentín study site experiments |
The change in desertification risk is then compared against the overall results. However, this is not a direct comparison, because this is not the intended purpose of the tool. For instance water stress risk can occur on a site because of a range of circumstances related to climate, soil, vegetation, farming practices and so on. A direct comparison against a measured soil moisture change on a certain depth in the soil is useless because many more factors are involved. So a lowering of water stress risk because of a technology and a change in moisture content cannot be compared, even relatively. The same holds true for all other processes/risks. Therefore the results are compared in a more general sense.
Conclusions and recommendations
- Overall the results are good, the tool shows what it is supposed to show: a lowering of a risk coincides with the application of a technology, in almost all cases. Since the risk factor is based on multivariate statistics, both the calculated risk, and the change of risk after application of a technology is relatively smaller than the experimental results often indicate. This is logical because the tool is an average of all sites and the effect of a particular situation will then be less pronounced.
- The results indicate that overall there are advantages and disadvantages in the tool. The advantages are first you get a single value for a desertification risk with which you can compare all sites, so very different processes become comparable, and second, if so desired, you get information on desertification risks that were not initially researched at a site. For instance an experiment that is meant to control water erosion also may have a certain risk for tillage erosion or water stress although this was not the subject of the experiment. Thus you get more information and a wider context.
- In the future, the tool could focus more on conservation and mitigation measures, this would make valuable addition, and permit much more than calculating a risk. This is logical: the tool was based on many observation points in each site, but since most of these sites have no widescale implementation of conservation measures, conservation is not part of the multivariate analysis. Conservation measures that are included are: conservation tillage types, a decrease of slope (terracing) and an increase in soil cover/mulch. At this point many technologies have to broken down in the processes they aim to affect but there is some interpretation needed for this. Contour ploughing could be interpreted as runoff control, intercropping as an increase of cover, drip irrigation as a decrease of overexploitation of groundwater, terraces must be combined with a decrease in sloep and runoff control before it has effect. At this point there is some freedom to make the system do what you want and like all models background knowledge is needed to operate it correctly.
- Some variables are really regional variables that do not change as a result of a technology (degree of land abandonment, climate, deforestation degree etc), and are therefore not distinctive between a traditional way of farming and an experiment. If these have a large effect in the end result they ‘overshadow’ the variables that are related directly to an experiment.
- Some relations are counterintuitive and show that this is a statistical tool and not a process based tool (although the variables link to processes). The most important are: rainfall amount is not a factor influencing water stress risk, only seasonality is. You can generate water stress in an areas with > 1500 mm rainfall, or no water stress in an area with < 280 mm of rainfall. Neither slope nor soil cover seems to affect water erosion very much, when many other factors are involved. Implementing terraces with a slope of <2% has little effect, as does implementing a full surface cover. Also processes are not linked: for example the effect of terraces in China is an increased water availability because of the increased infiltration on the flat surface as opposed to the sloping surface, but this relation is not included in the statistical basis of the indicator risk assessment tool and will therefore not show up. So terraces do not alleviate water stress.
- The tool generally does what it is supposed to do and the risk factors reflect well the experiments as reported in »Local field experiment results and conclusions. Some experience and knowledge is needed to operate the tool correctly. A clear advice for a future extension of the indicator tool is to i) extend the dataset with a focus on conservation measures, and ii) show the relative importance of the many variables so that it is clearer which variable has the largest influence on the result. This helps in understanding how the desertification index is generated and how large the effect of a technology must be to generate a difference, a decrease in risk, iii) look at counterintuitive relations that are apparent and somewhat confusing.
More details ... evaluating the Desertification Risk Assessment Tool with data from each field experiment
|
|
»Guadalentín, Spain
»Mação, Portugal
»Góis, Portugal
»Rendina, Italy (no experiments carried out)
»Crete, Greece
»Nestos River Delta, Greece
»Karapinar, Turkey
»Eskisehir, Turkey
»Sehoul, Morocco
|
»Zeuss Koutine, Tunisia
»Dzhanibek, Russia
»Novy, Russia
»Yan River Delta, China
»Boteti, Botswana
»Cointzio, Mexico
»Secano Interior, Chile
»Ribeira Seca, Cape Verde |
|


