Step 7
Step 7: Evaluating effectiveness of technology investments
In this step, the socio-economic analyses done so far will be contrasted against the biophysical impact of technologies according to PESERA. The first method to do this is cost-effectiveness analysis. This analysis allows for an assessment of biophysical effects before valuation of technologies from either a farmer or societal point of view. The analysis may be repeated to capture two relevant criteria:
- The investment costs of a technology relative to its effectiveness to reduce land degradation problems. The investment required may limit a land user or group of land users' capacity to apply a technology. The height of such an initial investment relative to the expected mitigation of land degradation is a policy-relevant indicator. As shown in the next criterion such costs should not necessarily be borne totally by public investment, but could form an essential step in designing financing mechanisms to facilitate adoption; and
- The total non-discounted cashflow of a technology relative to its effectiveness in reducing land degradation problems. Technologies will usually only be adopted if the land user can expect a return to his investment. From a policy perspective, this return (e.g. increased crop yields) is a private gain that in itself can stimulate uptake of the technology without a need to spend public resources. The real cost to society of undertaking the investment should thus subtract private returns to investment. The justification for a potential contribution by society to investing in land degradation mitigation technologies should offset costs against effect.
The effectiveness of technology investments can also be evaluated using the NPV values resulting from financial CBA (step 6). In this case the farmer valuation of a technology is compared with its effectiveness to mitigate land degradation. Negative NPV's signal cases in which policy incentives could be needed to motivate land users to adopt the technology. When the previous cost-effectiveness analysis using the total non-discounted cashflow is positive but the repeated analysis with NPV is negative, it can be concluded that the land user perceives benefits too late relative to the cost incurred. It is important for policy-makers to be aware of such a potential time lag.
In addition to the above, cost-effectiveness analysis provides a quick overview of the technical possibilities of remediating land degradation and the costs involved. A meaningful comparative cost-effectiveness analysis requires a (soil conservation policy) target to be set. Two different approaches can be taken:
- Setting a general target: when a general target is set, remedial action should be taken in all grid cells until they meet the target. For some grid cells the target may be reached at limited cost, but in order to reach the target in the last cells, very costly interventions may be necessary (and some cells might even then not reach the target, or perhaps none of the technologies considered is applicable). For this analysis, the cheapest investment meeting the target or the investment best approaching the target will be selected; and
- Setting an aggregate-level target: in this case, e.g. a global reduction target of 30% of soil erosion is specified. A map algorithm will be used to reach the target at minimum cost.
The above approaches will likely yield distinct conservation strategies. In the first case, 'hotspot' areas will have to be treated at high cost. In the second, those areas in an advanced state of degradation will be sacrificed and remediation efforts concentrated on less expensive moderately affected areas. The policy targets set can be part of a scenario study (step 12).
Data sources: 2) PESERA output data (step 2); 1) Investment costs, total non-discounted cashflows and NPV (steps 3-6); 3) Target levels for (selected) PESERA output variables.
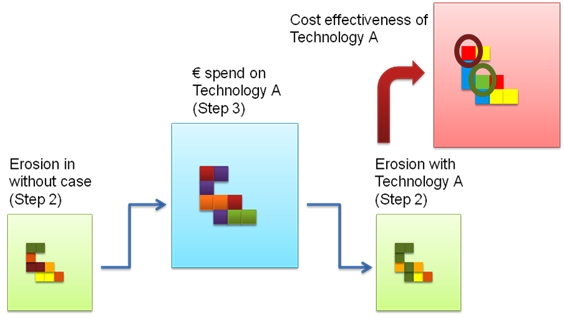
Intermediate products: 1) raster maps of cost-effectiveness of each technology for biophysical effects (see Table 3.1), e.g. expressed in monetary units spend (on a remediation technology investment) per unit of soil loss prevented (comparing with/without situation, see example in Figure 3.7); 2) raster maps of the spatial configuration of selected technologies to meet general or aggregate-level (policy) targets; 3) graphs showing the marginal cost vs. target fulfilment relationship.

Figure 3.7: Hypothetical example of calculating cost-effectiveness of a technology