Phase 1
Phase 1: Exploring land use change and its external drivers
The first analytical phase employs land use change analysis to unravel the historical dynamics of agro-ecosystem management in the study area. To allow the analysis, aerial photographs covering the study area (Torrealvilla catchment) for five different moments in time (1956, 1986, 2004, and 2008) are being digitised using the ArcMap application in ArcGIS. So far, the digitisation and classification of the 2004 land use map for the study area has been completed. The photographs of 1956, 1986, and 2004 are available in orthorectified, digital format and are sourced from the Regional Ministry of Agriculture, Water and Environment of Murcia. The 2008 images are accessed online via http://www.murcianatural.com/natmur08/. The work is being carried out in a close collaboration with the Desertification and Geo-Ecology Department of the Estación Experimental de Zonas Áridas (EEZA-CSIC) (Partner 6) and Centro De Edafología Y Biología Aplicada Del Segura of Consejo Superior de Investigaciones Científicas (CEBAS-CSIC) in Murcia, Spain.
Prior to land use digitisation and classification, two site visits, one during winter and one during summer of 2008, were carried out. The purpose was to become familiar with the range of land uses in the study area and be able to recognise and differentiate one land use type from the others on the aerial images. This included the identifying locations of dominant land uses, different land surface formations (e.g. characteristics of gullies), patch/assemblage size, distinctive shapes and configuration arrangement and density of components that make up a particular land use, etc. For example, dryland (wine) grapes are normally sparsely planted and are found mostly in hilly areas while irrigated (table/eating) grapes are denser, covered with nets, and are grown in valley areas not far from settlements. Confidence in recognising the distinctive features of the different types of land uses within the study area is crucial and contributes to consistency in digitising and assigning land use classes.
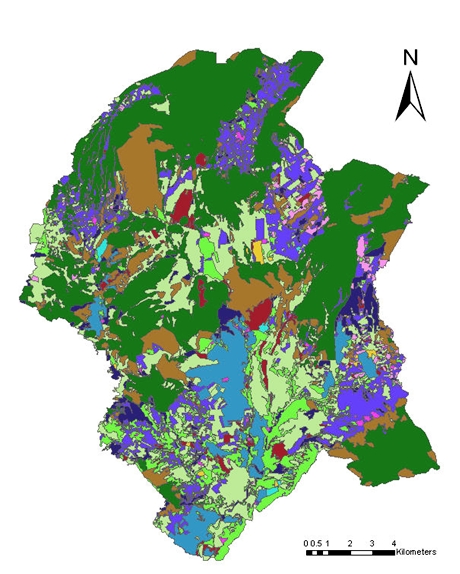
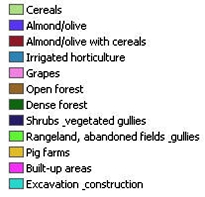
Following this, another site visit was arranged to assess the accuracy of the digitisation and classification of land uses to date (based on 2004 imagery). This process, also known as "ground truthing", was done by taking a sample list of patches with their respective geo-references (representative of all land use classes and spatial heterogeneity) to the field to assess whether the land use classes that have been assigned were correct. Ten land use classes were distinguished; namely cereals, almond/olive orchards, almond/olive orchards with cereals understorey, intensive irrigated agriculture (horticulture), grapes orchards, open pine forest, dense pine forest, shrubs (mattoral), rangeland and abandoned fields, pig farms (Figure 4.1). Following ground truthing, a field check confirmed 98% accuracy in digitisation based on 2004 land use mapping. Work is currently on-going to digitise and subsequently classify the land use maps for the other three moments in time.
This first phase also explores how various (external) socio-economic factors at the macro level (such as policy, market, population growth and compositional change, etc) have shaped agricultural land uses within the study area. Insights from this part of the analysis provide the wider socio-economic context of land use change that takes place in the study area. A triangulation approach is employed to identify the socio-economic insights which will further explain trends emerging from the spatial analysis. The triangulation method involves literature review, semi-structured interviews with household farmers, oral histories and key informant interviews. Multi-temporal land use maps produced at the beginning of this phase are used as visual aids for the interviews. This phase also investigates land managers/farmers' attitudes and behaviours to: agro-ecosystem management; land degradation/ desertification; land and agricultural markets; population growth and compositional changes; regional development; investment opportunities (short term versus long term); new land use opportunities; risk and uncertainty; policies related to agriculture, environment, and water management.
About 30 household farmers/land managers have already been interviewed for this purpose; these farmers are a sub-sample of those already taking part in ABM Interviews (see section 4.1.3). Stratified sampling, based on the dominant land uses observed from the results of the 2004 land use map digitisation, has been adopted for these interviews. Consequently, an even proportion of interviewees are expected, equally representing each of the present different land uses.


Figure 4.1: 2004 Land use map of Torrealvilla subcatchment